文章目录
项目地址:
https://gitee.com/sdsnzy/sys-info
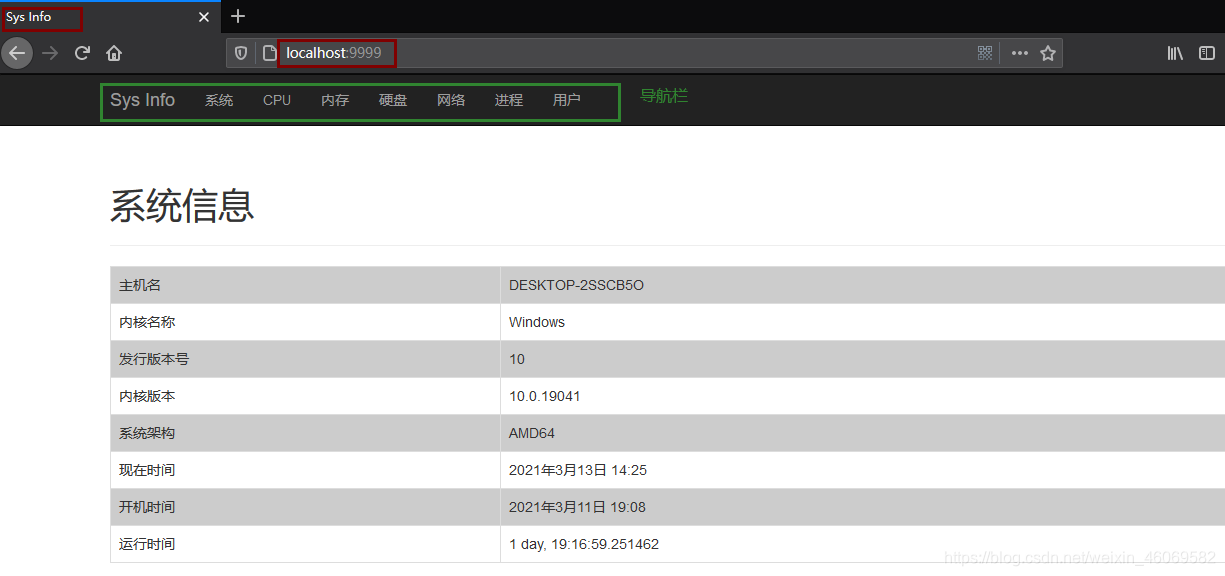
一、首页
psutil:是一个跨平台库(http://pythonhosted.org/psutil/)能够轻松实现获取系统运行的进程和系统利用率(包括CPU、内存、磁盘、网络等)信息。它主要用来做系统监控,性能分析,进程管理。它实现了同等命令行工具提供的功能,如ps、top、lsof、netstat、ifconfig、who、df、kill、free、nice、ionice、iostat、iotop、uptime、pidof、tty、taskset、pmap等。目前支持32位和64位的Linux、Windows、OS X、FreeBSD和Sun Solaris等操作系统.
安装psutil:pip install psutil
使用psutil模块参考:https://www.cnblogs.com/saneri/p/7528283.html
1.1视图函数
host/views.py
from django.shortcuts import render
from datetime import datetime
import platform, os, psutil
def index(request):
    try:
        info = os.uname()
    except Exception as e:
        info = platform.uname()
    sys_name = info.node
    kernel_name = info.system
    kernel_no = info.release
    kernel_version = info.version
    sys_framework = info.machine
    boot_time = datetime.fromtimestamp(psutil.boot_time())
    now_time = datetime.now()
    print(boot_time, now_time)
    up_time = now_time - boot_time
    return render(request, 'host/index.html', locals())
1.2 前端界面
templates/host/index.html
<!-- 继承base模板 -->
{% extends 'host/base.html' %}
{% block title %}Sys Info{% endblock %}
{% block content %}
    <div class="page-header">
        <h1>系统信息</h1>
    </div>
    <div>
        <table class="table table-bordered">
            <tr>
                <td>主机名</td>
                <td>{

   { sys_name }}</td>
            </tr>
            <tr>
                <td>内核名称</td>
                <td>{

   { kernel_name }}</td>
            </tr>
            <tr>
                <td>发行版本号</td>
                <td>{

   { kernel_no }}</td>
            </tr>
            <tr>
                <td>内核版本</td>
                <td>{

   { kernel_version }}</td>
            </tr>
            <tr>
                <td>系统架构</td>
                <td>{

   { sys_framework }}</td>
            </tr>
            <tr>
                <td>现在时间</td>
                <td>{

   { now_time }}</td>
            </tr>
            <tr>
                <td>开机时间</td>
                <td>{

   { boot_time }}</td>
            </tr>
            <tr>
                <td>运行时间</td>
                <td>{

   { up_time }}</td>
            </tr>
        </table>
    </div>
{% endblock %}
1.3 测试
访问:http://localhost:9999/
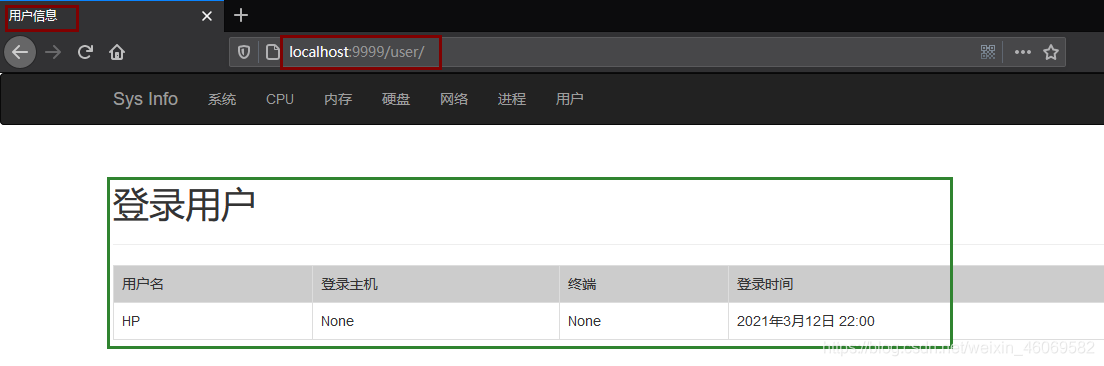
二、用户页
2.1 视图函数
host/views.py
def user(request):
    users = psutil.users()
    return render(request, 'host/user.html', locals())
2.2 自定义时间过滤器
host/templatetags/filter.py
from django import template
from datetime import datetime
register = template.Library()

@register.filter(name='timefmt')
def timefmt(value):
    """将时间戳转换成datetime类型的时间"""
    return datetime.fromtimestamp(value)
2.3 前端页面
templates/host/user.html
<!-- 继承base模板 -->
{% extends 'host/base.html' %}
<!-- 时间过滤器 -->
{% load filter %}
{% block title %} 用户信息 {% endblock %}
{% block content %}
    <div class="page-header">
        <h1>登录用户</h1>
    </div>
    <div>
        <table class="table table-bordered">
            <tr>
                <td>用户名</td>
                <td>登录主机</td>
                <td>终端</td>
                <td>登录时间</td>
            </tr>
            {% for user in users %}
            <tr>
                <td>{

   { user.name }}</td>
                <td>{

   { user.terminal }}</td>
                <td>{

   { user.host }}</td>
                <td>{

   { user.started | timefmt }}</td>
            </tr>
            {% endfor %}
        </table>
    </div>
{% endblock %}
2.4 测试
访问:http://localhost:9999/user/
三、cpu信息
3.1 视图函数
host/views.py
from host.models import UserCpuPercent
def cpu(request, chart=None):
    logical_core_num = psutil.cpu_count()
    physical_core_num = psutil.cpu_count(logical=False)
    try:
        load_avg = os.getloadavg()
    except Exception as e:
        load_avg = ['', '', '']
    cpu_time_percent = psutil.cpu_times_percent()
    else_percent = 0.0
    for i in range(3, 5):
        else_percent += cpu_time_percent[i]
    try:
        cpu_freq = psutil.cpu_freq()
    except AttributeError:
        cpu_freq = None
    if chart == 'line':
    	# 折线图则获取存储在数据库的最新的30条记录
        datas = UserCpuPercent.objects.order_by('-id')[:30]
        return render(request, 'host/cpu-line.html', locals())
    elif chart == 'pie':
        return render(request, 'host/cpu-pie.html', locals())
    return render(request, 'host/cpu.html', locals())
3.2 自定义计算过滤器
host/templatetags/filter.py
@register.filter(name='cpu_val_fmt')
def cpu_val_fmt(value):
    return  round(value/1000, 2)
3.3 创建数据库模型
1)host/models.py
from django.db import models
# 定时任务定期扫描并存储。
class UserCpuPercent(models.Model):
    create_time = models.DateTimeField(auto_now_add=True, verbose_name="扫描时间")
    user_percent = models.FloatField(verbose_name="用户CPU占用百分比")
2)应用数据模型:
1.生成迁移文件:根据模型类生成 sql 语句
python manage.py makemigrations
2.执行迁移:执行 sql 语句生成数据表
python manage.py migrate
3.4 cpu头部信息汇总页面
cpu的三种显示形式的头部信息相同,所以单独建立文件保存,方便后续添加其他形式显示cpu
templates/host/cpu-header.html
<div class="page-header">
    <a {% if not chart %}id="display"{% endif %} href="/cpu/">CPU 信息</a>
    <a {% if chart == 'line' %}id="display"{% endif %} href="/cpu/line/">CPU
        折线图</a>
    <a {% if chart == 'pie' %}id="display"{% endif %} href="/cpu/pie/">CPU 饼图</a>
</div>
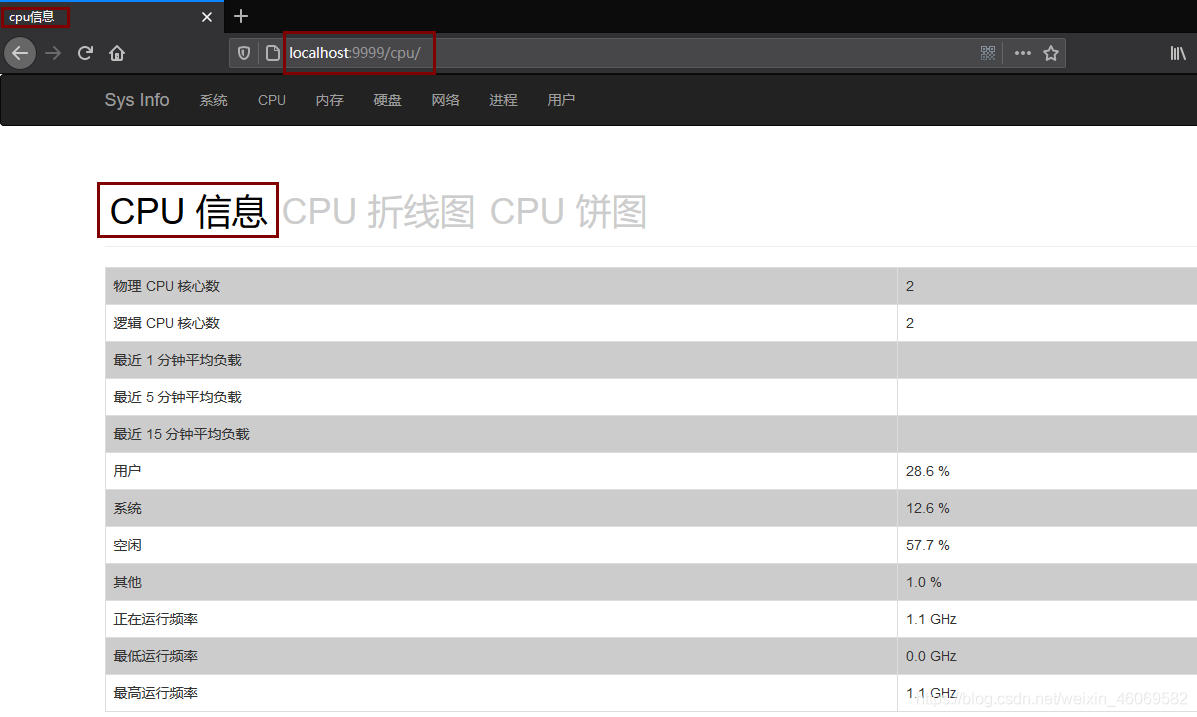
3.5 cpu表格信息页面
templates/host/cpu.html
<!-- 继承base模板 -->
{% extends 'host/base.html' %}
<!-- 计算过滤器 -->
{% load filter %}
{% block title %} cpu信息 {% endblock %}
{% block content %}
    {% include 'host/cpu-header.html' %}
    <div>
        <div id="cpu_info">
             <table class="table table-bordered">
            <tr>
                <td>物理 CPU 核心数</td>
                <td>{

   { physical_core_num }}</td>
            </tr>
            <tr>
                <td>逻辑 CPU 核心数</td>
                <td>{

   { logical_core_num }}</td>
            </tr>
            <tr>
                <td>最近 1 分钟平均负载</td>
                <td>{

   { load_avg.0 }}</td>
            </tr>
            <tr>
                <td>最近 5 分钟平均负载</td>
                <td>{

   { load_avg.1 }}</td>
            </tr>
            <tr>
                <td>最近 15 分钟平均负载</td>
                <td>{

   { load_avg.2 }}</td>
            </tr>
            <tr>
                <td>用户</td>
                <td>{

   { cpu_time_percent.user }} %</td>
            </tr>
            <tr>
                <td>系统</td>
                <td>{

   { cpu_time_percent.system }} %</td>
            </tr>
            <tr>
                <td>空闲</td>
                <td>{

   { cpu_time_percent.idle }} %</td>
            </tr>
            {% if cpu_time_percent.nice %}
                <tr>
                    <td>nice</td>
                    <td>{

   { cpu_time_percent.nice }} %</td>
                </tr>
            {% endif %}
            {% if cpu_time_percent.iowait %}
                <tr>
                    <td>iowait</td>
                    <td>{

   { cpu_time_percent.iowait }} %</td>
                </tr>
            {% endif %}
            {% if else_percent %}
                <tr>
                    <td>其他</td>
                    <td>{

   { else_percent }} %</td>
                </tr>
            {% endif %}
            {% if cpu_freq %}
                <tr>
                    <td>正在运行频率</td>
                    <td>{

   { cpu_freq.current | cpu_val_fmt }} GHz</td>
                </tr>
                <tr>
                    <td>最低运行频率</td>
                    <td>{

   { cpu_freq.min | cpu_val_fmt }} GHz</td>
                </tr>
                <tr>
                    <td>最高运行频率</td>
                    <td>{

   { cpu_freq.max | cpu_val_fmt }} GHz</td>
                </tr>
            {% endif %}
        </table>
        </div>

{% endblock %}
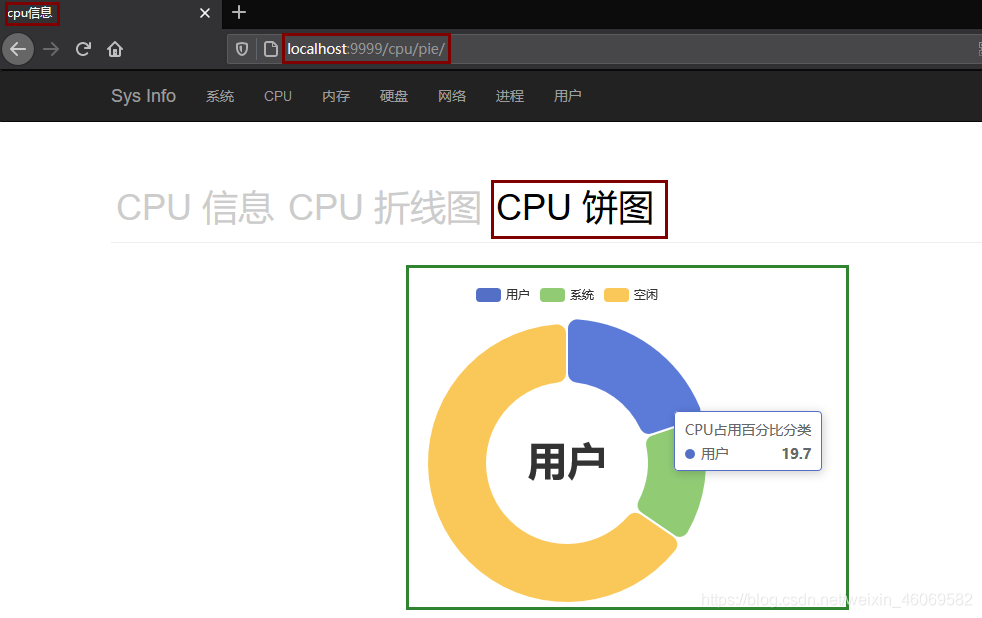
3.6 饼图页面
echarts绘制饼图官方文档:https://echarts.apache.org/examples/zh/editor.html?c=pie-borderRadius
host/cpu-pie.html
<!-- 继承base模板 -->
{% extends 'host/base.html' %}
<!-- 计算过滤器 -->
{% load filter %}
{% block title %} cpu信息 {% endblock %}
{% block content %}
    {% include 'host/cpu-header.html' %}
    <div>
        <div id="main" style="width: 80%;height:400px;"></div>
    </div>
    <script type="text/javascript">
        // 基于准备好的dom,初始化echarts实例
        var myChart = echarts.init(document.getElementById('main'));

        option = {


            tooltip: {


                trigger: 'item'
            },
            legend: {


                top: '5%',
                left: 'center'
            },
            series: [
                {


                    name: 'CPU占用百分比分类',
                    type: 'pie',
                    radius: ['40%', '70%'],
                    avoidLabelOverlap: false,
                    itemStyle: {


                        borderRadius: 10,
                        borderColor: '#fff',
                        borderWidth: 2
                    },
                    label: {


                        show: false,
                        position: 'center'
                    },
                    emphasis: {


                        label: {


                            show: true,
                            fontSize: '40',
                            fontWeight: 'bold'
                        }
                    },
                    labelLine: {


                        show: false
                    },
                    data: [
                        {

     value: {

     {

      cpu_time_percent.user }}, name: '用户'},
                        {

     value: {

     {

      cpu_time_percent.system }}, name: '系统'},
                        {

     value: {

     {

      cpu_time_percent.idle }}, name: '空闲'},
                    ]
                }
            ]
        };
        // 使用刚指定的配置项和数据显示图表。
        myChart.setOption(option);
    </script>
{% endblock %}
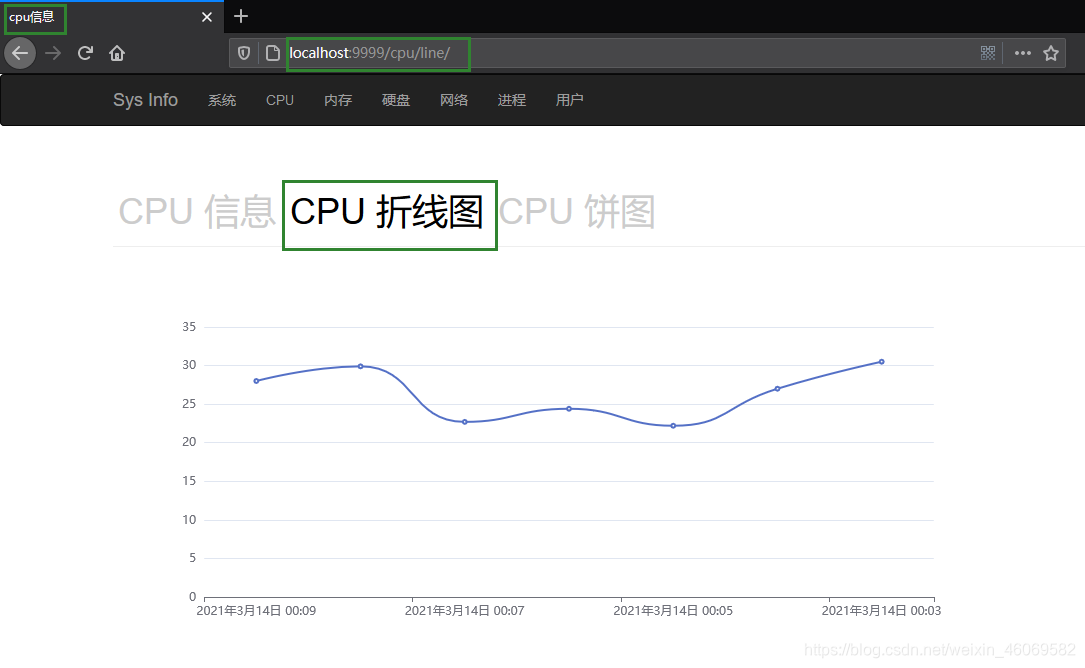
3.7 折线图页面
此项目包括定时任务、异步任务,单立博客:
Django获取服务器信息系统设计----(3)cpu折线图表(Celery异步任务、定时任务)
3.8 测试
访问:
- http://localhost:9999/cpu/
- http://localhost:9999/cpu/pie/
- http://localhost:9999/cpu/line/