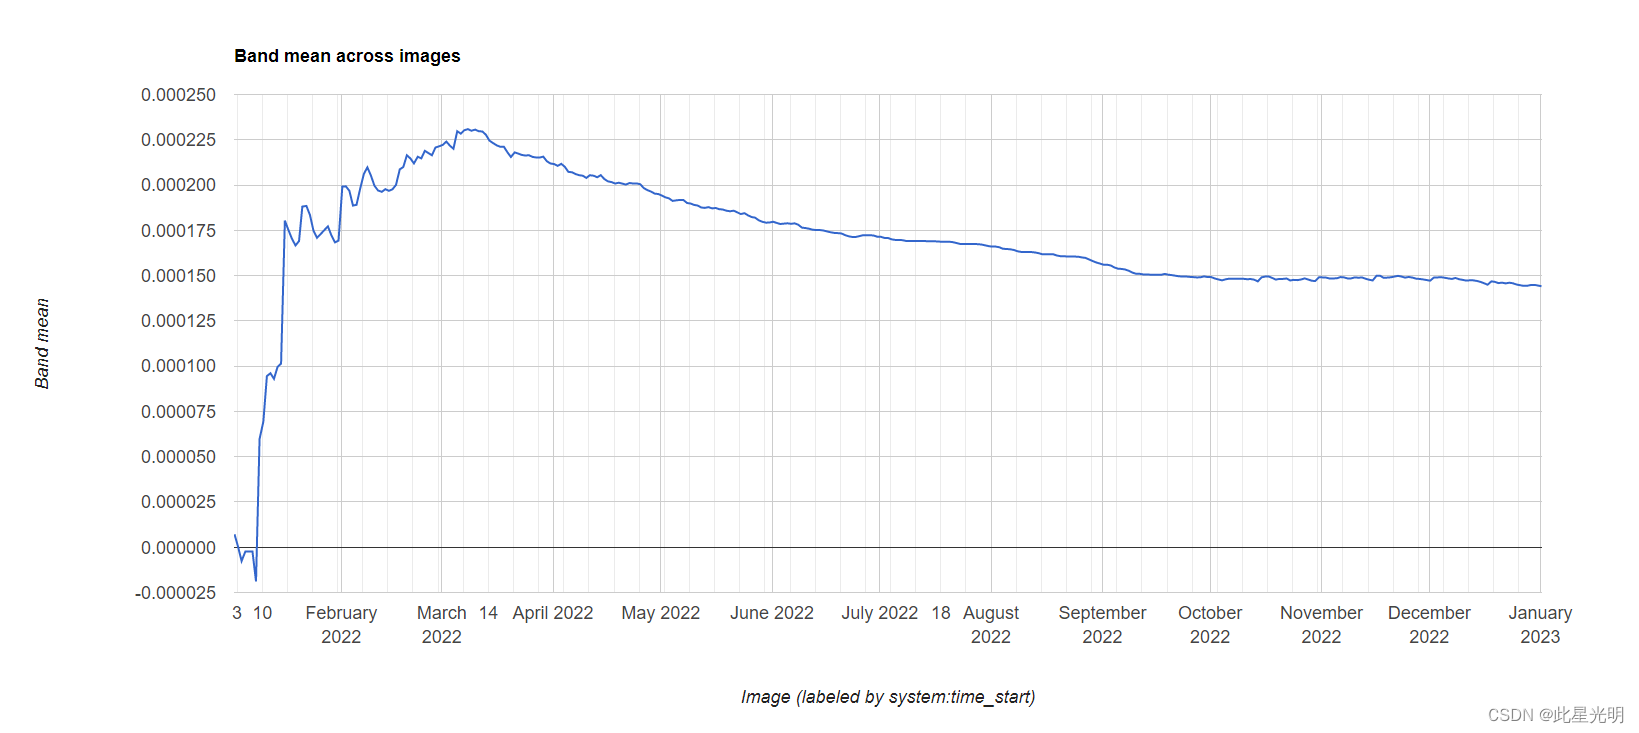
如何使用ui.Chart.image.series函数来实现一年影像图表的生成,用于查看一年当中的数值变化,期间我们会使用函数ee.ImageCollection.fromImages来获取一年当中不同天数的影像。本文所使用的而数据为COPERNICUS/S5P/OFFL/L3_SO2 ..。这里的关键是首先建立一个365天的时间序列,然后将影像按照每一天影像筛选出来,在通过sort按照时间进行排序,最后按照平均值传参给图表函数,求出每一天该区域影像值的变化。
函数:
ui.Chart.image.series(imageCollection, region, reducer, scale, xProperty)
Generates a Chart from an ImageCollection. Plots derived values of each band in a region across images. Usually a time series.
-
X-axis: Image, labeled by xProperty value.
-
Y-axis: Band value.
-
Series: Band names.
Returns a chart.
Arguments:
imageCollection (ImageCollection):
An ImageCollection with data to be included