连续变量
ggplot(vis.data, aes(x=col, y=row, color = Bnip3l)) + geom_point() + theme_void()+
  # scale_discrete_manual()
 # scale_color_manual(  colorRampPalette(c("blue","white","green"))(12)  #针对分类变量
  scale_color_continuous(
    low = "blue",
    high = "green"
  )
分类变量
scale_color_manual
scale_colour_gradient(
  ...,
  low = "#132B43",
  high = "#56B1F7",
  space = "Lab",
  na.value = "grey50",
  guide = "colourbar",
  aesthetics = "colour"
)
 scale_fill_gradient(
    low = "blue",
    high = "red",
    space = "Lab",
    na.value = "grey50",
    guide = "colourbar",
    aesthetics = "color"  #fill
  )
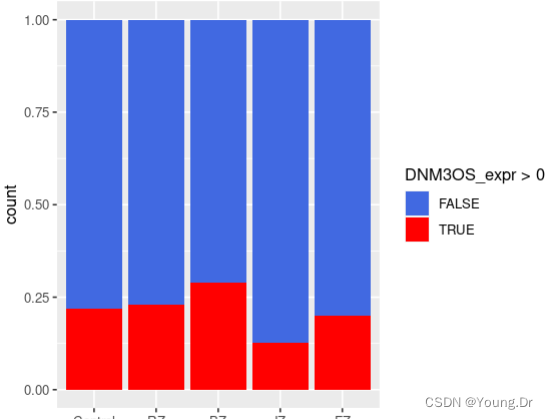
library(ggplot2)
ggplot(subset_data@meta.data,
       aes(x=Idents(subset_data),fill=DNM3OS_expr > 0)) + geom_bar(position = "fill")  +
  scale_fill_manual(values = c("royalblue", "red"))#scale_fill_gradientn(colors = colorRampPalette(c("royalblue", "firebrick3"))(12))#colorRampPalette(c("royalblue","firebrick3"))(2)