博主本学期同时开了matlab课和信号与系统,所以整理下在信号与系统用的一些函数
类似的一些常见信号的画法
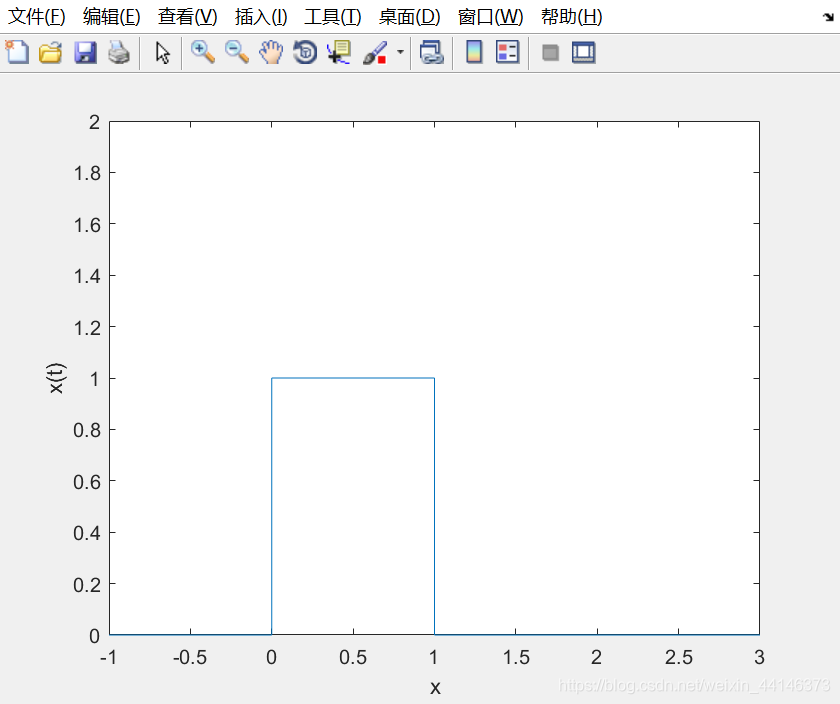
%画个方波
t=[-1 0 0 1 1 3];
x=[0 0 1 1 0 0];
plot(t,x);
xlabel('x');ylabel('x(t)');
axis([-1 3 0 2]);
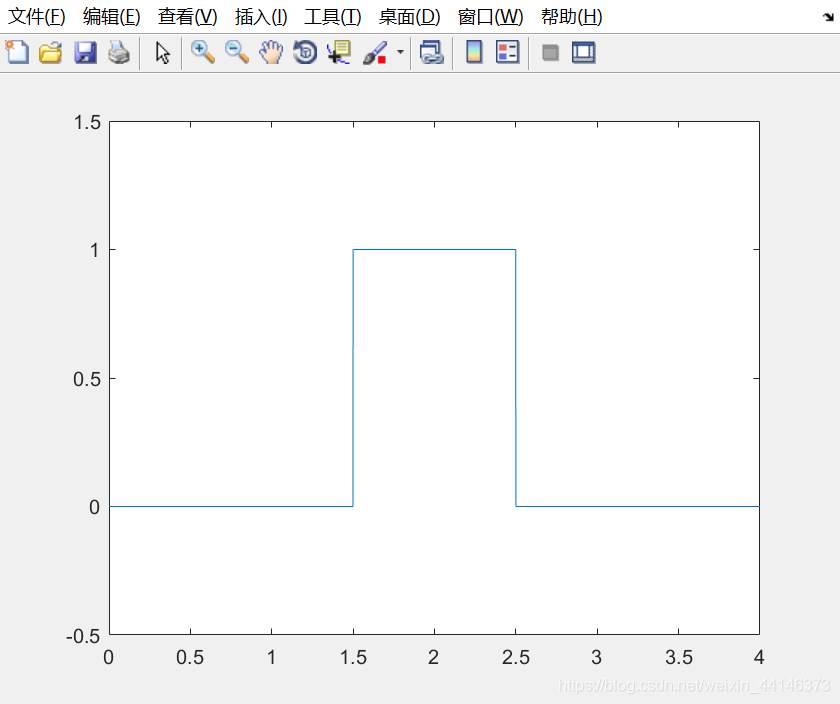
t=0:0.001:4;
T=1;
ft=rectpuls(t-T-T,T);
plot(t,ft)
axis([0,4,-0.5,1.5]);
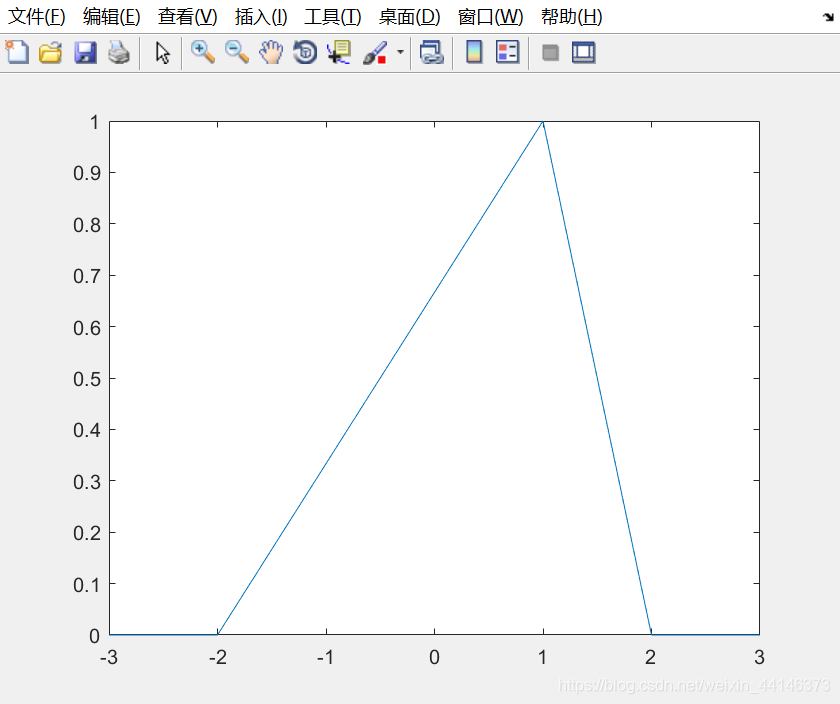
%画个三角波
t=-3:0.001:3;
ft=tripuls(t,4,0.5);
plot(t,ft);
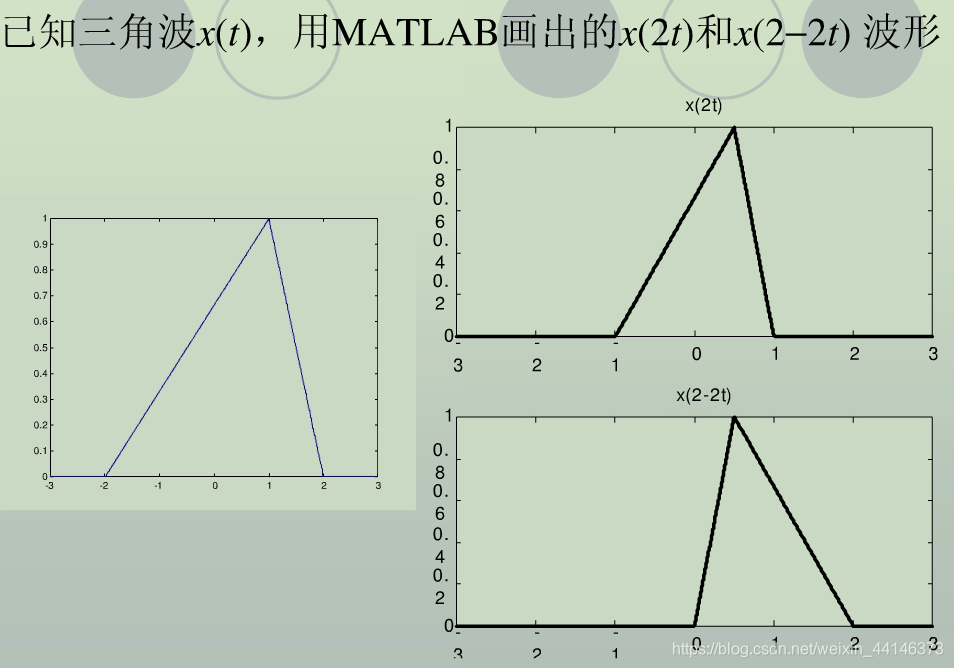
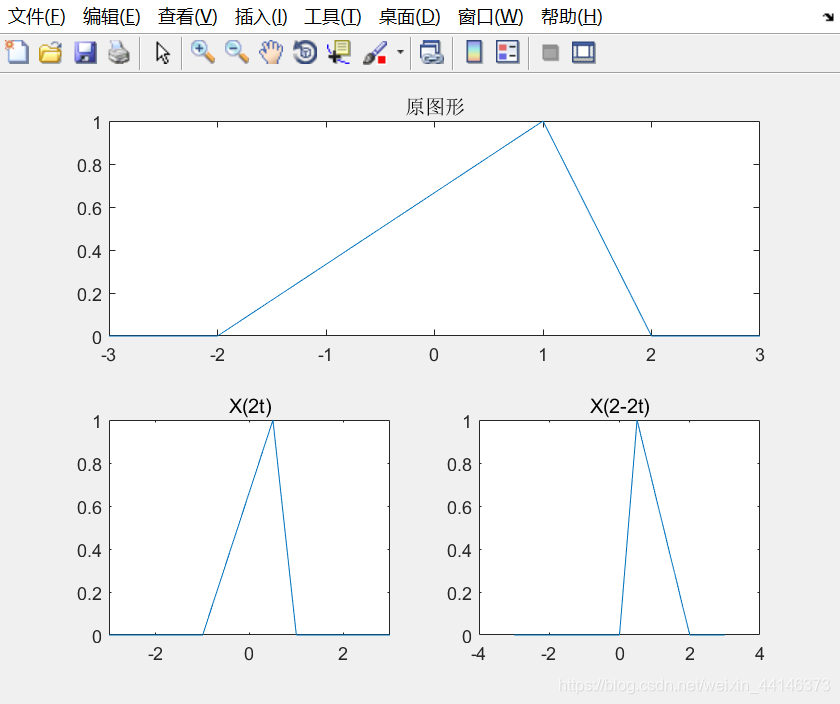
t=-3:0.001:3;
x=tripuls(t,4,0.5);
subplot(211);
plot(t,x);
title('原图形')
axis([-3,3,0,1]);
ft1=tripuls(2*t,4,0.5);
subplot(223);
plot(t,ft1);
axis([-3,3,0,1]);
title('X(2t)');
ft2=tripuls(2-2*t,4,0.5);
subplot(224);
plot(t,ft2)
title('X(2-2t)')

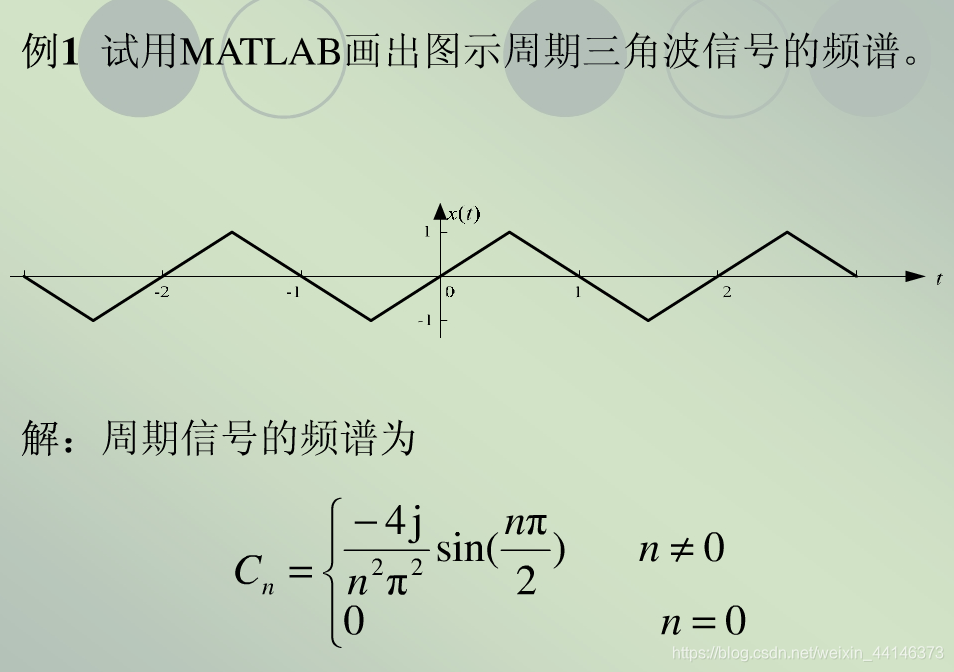
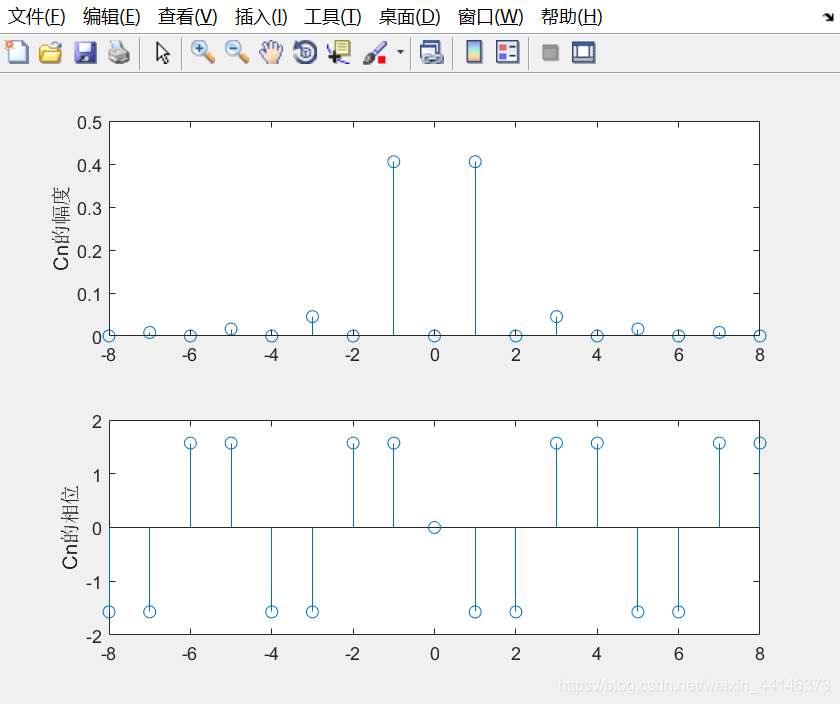
N=8;
n1=-N:-1;
c1=-4*j*sin(n1.*pi./2)./pi^2./n1.^2;
c0=0;
n2=1:N;
c2=-4*j*sin(n2*pi/2)/pi^2./n2.^2;
cn=[c1,c0,c2];
n=-N:N;
subplot(2,1,1);
stem(n,abs(cn));ylabel('Cn的幅度');
subplot(2,1,2);
stem(n,angle(cn));
ylabel('Cn的相位');