知乎强文手把手教你AdaBoost是理解集成学习的很好教材,根据此文,我编写了一下python代码,可以用来可视化展示经过提升算法之后的分类器图像。核心的逻辑其实就是这步之间的左右互搏:
一、根据权重weights获得最优学习器G和alpha值
二、最优学习器G和alpha值更新权重weights
我们把学习器G和alpha封装到一个IndividualLearner的类D中,这个模型简直可以用DW两个字母来概括:D↔W
import numpy as np
fevals = [0,1,2,3,4,5,6,7,8,9]
labels = [1,1,1,-1,-1,-1,1,1,1,-1]
weights = [1/len(fevals) for i in range(10)]
thresholds = [-0.5+i for i in range(len(labels)+1)]
threshold = 2.5
#polar代表分类器的极性(左阳右阴为1,左阴右阳为-1)
polar = 1
#根据分类器的threshold和polar,生成(较弱的)个体学习器
def indilearner(threshold,polar=1):
return [ np.sign((threshold-i)*polar) for i in range(len(labels))]
#根据权重和学习器的正确性来得到学习器的误差
def get_learnerror(Gm,weights):
return np.array([ weights[i]*abs(labels[i]-Gm[i])/2 for i in range(len(labels))]).sum()
class IndividualLearner():
def __init__(self,weights):
self.weights = weights
self.besthres = 9.5
self.minerror = 0.5
self.bespolar = 1
self.best_learner = self.get_best_learner()
def get_best_learner(self):
thresholds = [-0.5+i for i in range(len(labels)+1)]
for threshold in thresholds:
for polar in (1,-1):
#我们通常使用Gm来表示第m个个体学习器
Gm = indilearner(threshold,polar)
#我们常使用em来表示第m个学习器的误差
em = get_learnerror(Gm,self.weights)
if em<self.minerror:
self.minerror = em
self.besthres = threshold
self.bespolar = polar
return indilearner(self.besthres,self.bespolar)
def get_alpha(self):
return(0.5*np.log((1-self.minerror)/self.minerror))
#根据alpha和学习器的准确率性能来更新权重
def update_weights(weights,alpha_m,Gm,y):
z = np.array([np.exp(-alpha_m*y[i]*Gm[i])*weights[i] for i in range(len(labels))])
Z = z.sum()
return z/Z
def printweights(weights):
for w in weights:
print(format(w,'.4f'),end='\t')
print('\n')
Gs = []
As = []
Ws = []
rounds = 3
for i in range(rounds):
D = IndividualLearner(weights)
G = D.best_learner
alpha = D.get_alpha()
weights = update_weights(weights,alpha,G,labels)
Gs.append(G)
As.append(alpha)
Ws.append(weights)
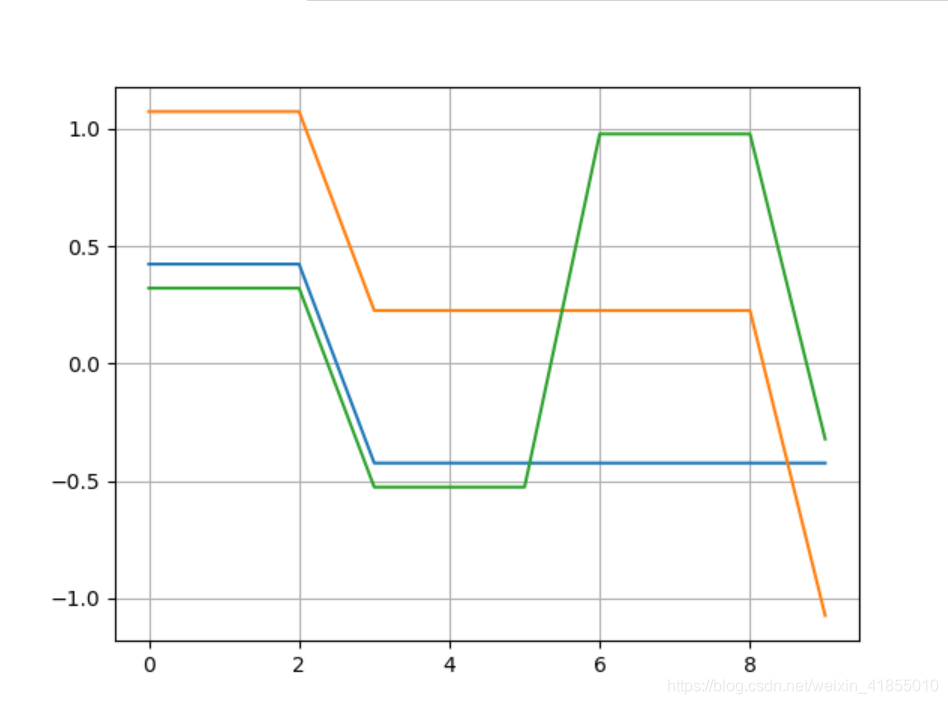
f = [np.array(Gs[i])*As[i] for i in range(rounds)]
f1 = f[0]
f2 = f[0]+f[1]
f3 = f[0]+f[1]+f[2]
import matplotlib.pyplot as plt
plt.grid()
plt.plot(fevals,f1)
plt.plot(fevals,f2)
plt.plot(fevals,f3)
plt.legend()
plt.show()
最后画出的是经过3次boost之后,学习器的曲线演化图: