1、原理
1.1 前言:
anchor box其实就是从训练集的所有ground truth box中统计(使用k-means)出来的在训练集中最经常出现的几个box形状和尺寸。可以预先将这些统计上的先验(或来自人类的)经验加入到模型中,这样模型在学习的时候,瞎找的可能性就更小了些(玄学思想)。
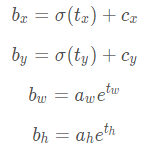
1.2 公式:
1.3 效果:
只能加快模型收敛的速度,对模型的其他性能无影响
2、重置
2.1 模型下载:
使用GitHub原有模型,在此基础上修改:
https://github.com/lars76/kmeans-anchor-boxes
2.2 模型修改:
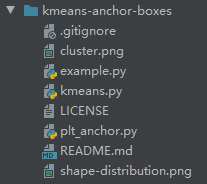
将下载后的模型删去不需要的部分:
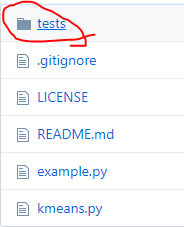
将test文件删除,留下example.py和kmeans.py,在根目录下创建plt_anchor.py:
2.3 文件内容:
- example.py:
import glob
import xml.etree.ElementTree as ET
import tqdm
import numpy as np
from kmeans import kmeans, avg_iou
ANNOTATIONS_PATH = "E:/pytorch/ultralytics-yolov3/yolov3-sheep/data/Annotations/"
#以正斜杠/这种形式可以防止反斜杠带来的转义错误
CLUSTERS = 9
def load_dataset(path):
dataset = []
for xml_file in tqdm.tqdm(glob.glob("{}/*xml".format(path))):
print(xml_file)
tree = ET.parse(xml_file)
height = int(tree.findtext("./size/height"))
width = int(tree.findtext("./size/width"))
for obj in tree.iter("object"):
xmin = int(float(obj.findtext("bndbox/xmin"))) / width
ymin = int(float(obj.findtext("bndbox/ymin"))) / height
xmax = int(float(obj.findtext("bndbox/xmax"))) / width
ymax = int(float(obj.findtext("bndbox/ymax"))) / height
dataset.append([xmax - xmin, ymax - ymin])
return np.array(dataset)
data = load_dataset(ANNOTATIONS_PATH)
print(ANNOTATIONS_PATH)
out = kmeans(data, k=CLUSTERS)
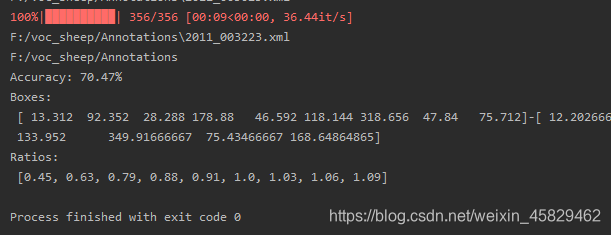
print("Accuracy: {:.2f}%".format(avg_iou(data, out) * 100))
print("Boxes:\n {}-{}".format(out[:, 0]*416, out[:, 1]*416))
ratios = np.around(out[:, 0] / out[:, 1], decimals=2).tolist()
print("Ratios:\n {}".format(sorted(ratios)))将 ANNOTATIONS_PATH =’’ 路径改成自己的.
运行后:
- plt_anchor.py:
import glob
import xml.etree.ElementTree as ET
import tqdm
import numpy as np
import matplotlib.pyplot as plt
from kmeans import kmeans, avg_iou
ANNOTATIONS_PATH = "E:/pytorch/ultralytics-yolov3/yolov3-sheep/data/Annotations/"
#以正斜杠/这种形式可以防止反斜杠带来的转义错误
CLUSTERS = 9
BBOX_NORMALIZE = True
def show_cluster(cluster, max_points=2000):
if len(data) > max_points:
idx = np.random.choice(len(data),max_points)
data = data[idx]
plt.scatter(data[:, 0], data[:, 1], s=5, c='lavender')
plt.scatter(cluster[:, 0], cluster[:, 1], c='red', s=100, marker="^")
plt.xlabel("Width")
plt.ylabel("Height")
plt.title("Bounding and anchor distribution")
plt.savefig("cluster.png")
plt.show()
def show_w_h(data,cluster,bins=50):
if data.dtype != np.float32:
data = data.astype(np.float32)
width = data[:, 0]
height = data[:, 1]
ratio = height / width
plt.figure(1, figsize=(20, 6))
plt.subplot(131)
plt.hist(width, bins=bins, color='blue', rwidth=0.8)
plt.xlabel('Width')
plt.ylabel('Number')
plt.grid(True, linestyle='-.')
plt.title('Distribution of Width')
plt.subplot(132)
plt.hist(height, bins=bins, color='green', rwidth=0.8)
plt.xlabel('Height')
plt.ylabel('Number')
plt.grid(True, linestyle='-.')
plt.title('Distribution of Height')
plt.subplot(133)
plt.hist(ratio, bins=bins, color='magenta', rwidth=0.8)
plt.xlabel('Height / Width')
plt.ylabel('Number')
plt.grid(True, linestyle='-.')
plt.title('Distribution of aspect ratio[Height / Width]')
plt.savefig("shape-distribution.png")
plt.show()
def sort_cluster(cluster):
if cluster.dtype != np.float32:
cluster = cluster.astype(np.float32)
area = cluster[:, 0] * cluster[:, 1]
ratio = cluster[:, 1:2] / cluster[:, 0:1]
return np.concatenate([cluster, ratio], axis=-1)
def load_dataset(path):
dataset = []
for xml_file in tqdm.tqdm(glob.glob("{}/*xml".format(path))):
print(xml_file)
tree = ET.parse(xml_file)
height = int(tree.findtext("./size/height"))
width = int(tree.findtext("./size/width"))
for obj in tree.iter("object"):
xmin = int(float(obj.findtext("bndbox/xmin"))) / width
ymin = int(float(obj.findtext("bndbox/ymin"))) / height
xmax = int(float(obj.findtext("bndbox/xmax"))) / width
ymax = int(float(obj.findtext("bndbox/ymax"))) / height
dataset.append([xmax - xmin, ymax - ymin])
return np.array(dataset)
data = load_dataset(ANNOTATIONS_PATH)
print(ANNOTATIONS_PATH)
out = kmeans(data, k=CLUSTERS)
out_sorted = sort_cluster(out)
if out.dtype != np.float32:
cluster = out.astype(np.float32)
show_cluster(data, out, max_points=2000)
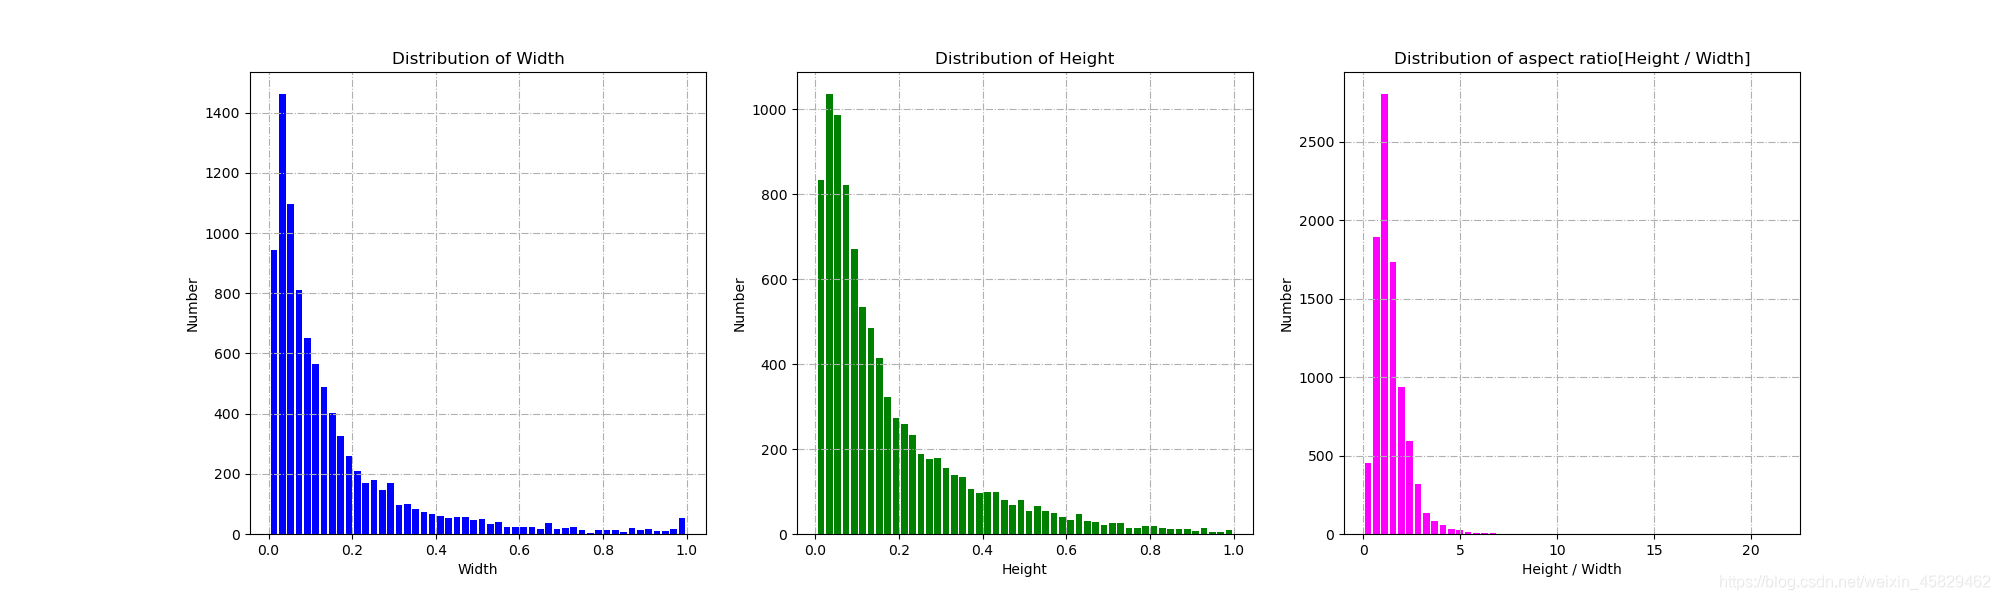
show_w_h(data, out, bins=50)运行后:
簇类图: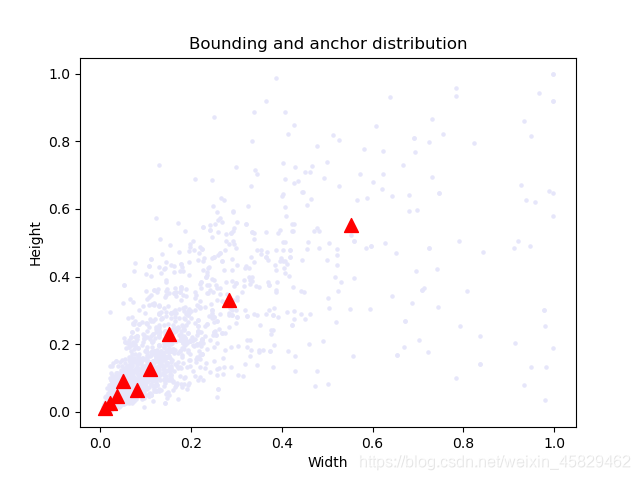
长宽图: