在《python数据分析基础》6.3ggplot使用过程中报错
from ggplot import *
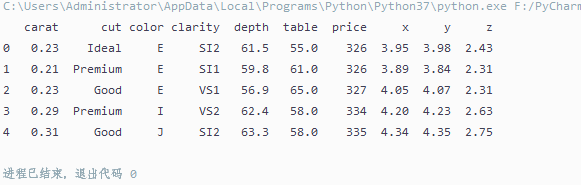
print(diamonds.head())

按照报错打开
注意:修改时修改ggplot的函数或者方法名称,而不要修改pandas的函数或者方法名。


date_types = (
pd.tslib.Timestamp,
pd.DatetimeIndex,
pd.Period,
pd.PeriodIndex,
datetime.datetime,
datetime.time)
tslib在pandas中 别名_tslib
将之改为_tslib后,继续报错ModuleNotFoundError: No module named ‘pandas.lib’

按照上步骤继续修改
from pandas.lib import Timestamp
#修改为
from pandas._libs import Timestamp
继续报错:AttributeError: module ‘pandas’ has no attribute ‘tslib’

继续修改:
date_types = (
pd.tslib.Timestamp,
pd.DatetimeIndex,
pd.Period,
pd.PeriodIndex,
datetime.datetime,
datetime.time)
#修改为
date_types = (
pd._tslib.Timestamp,
pd.DatetimeIndex,
pd.Period,
pd.PeriodIndex,
datetime.datetime,
datetime.time)
三次修改后成功
原因:可能是版本问题,即pandas最新版与ggplot之间存在版本差距,即ggplot引用的是旧版的pandas.
ggplot的最新版也是2016年的呢,一直没有更新

但是,我的pandass是1.0.1的新版

而pandas1.0.1发行时间为2020年

所以函数名称存在变化,因而修改时修改ggplot更好,修改pandas会影响其他mudule的使用。
from ggplot import *
print(diamonds.head())
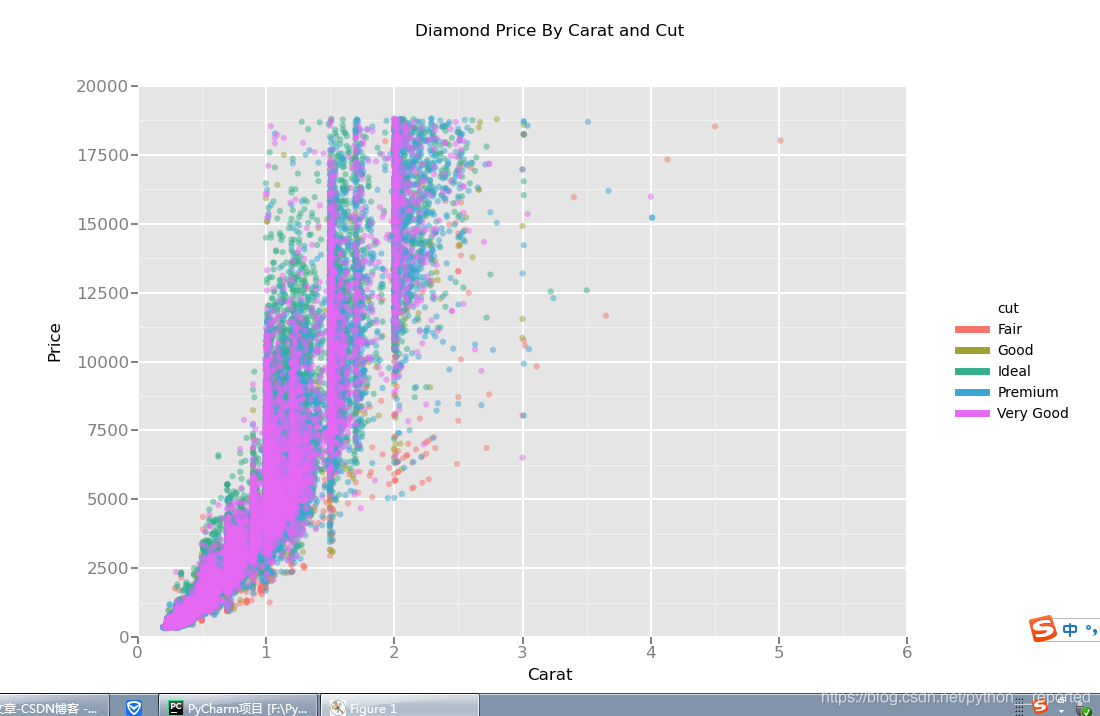
plt3 = ggplot(diamonds, aes(x='carat', y='price', color='cut')) + geom_point(alpha=0.5) + \
scale_color_gradient(low='#05D9F6', high='#5011D1') + xlim(0,6) + ylim(0,20000) + \
xlab('Carat') +ylab('Price') + ggtitle('Diamond Price By Carat and Cut') + theme_gray()
print(plt3)
ggplot.save(plt3,"ggplot_plots.png")
#此处的源码为ggsave(plt3,"ggplot_plots.png"),
#应当修改为ggplot.save(plt3,"ggplot_plots.png")
不然会报错:NameError: name ‘ggsave’ is not defined

最后画出来的图形为: