%matplotlib inline
import numpy as np
import pandas as pd
import seaborn as sns
from scipy import stats
import matplotlib as mpl
import matplotlib.pyplot as plt
sns.set(style="ticks")
np.random.seed(sum(map(ord,"axis_grids")))
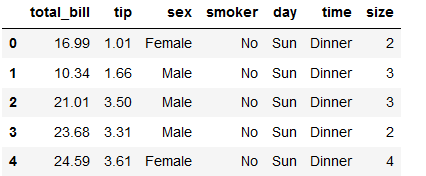
tips = sns.load_dataset("tips")
tips.head()
g = sns.FacetGrid(tips, col="time")
g.map(plt.hist,"tip")
g = sns.FacetGrid(tips, col="sex", hue="smoker")
g.map(plt.scatter,"total_bill","tip", alpha=.7)
g.add_legend();
g = sns.FacetGrid(tips, row="smoker", col="time", margin_titles=True)
g.map(sns.regplot,"size","total_bill", color=".1", fit_reg=False, x_jitter=.1);
g = sns.FacetGrid(tips, col="day", size=4, aspect=.5)
g.map(sns.barplot,"sex","total_bill")
from pandas import Categorical
ordered_days = tips.day.value_counts().index
print(ordered_days)
ordered_days = Categorical(['Thur','Fri','Sat','Sun'])
g = sns.FacetGrid(tips, row="day", row_order=ordered_days,
size=1.7, aspect=4,)
g.map(sns.boxplot,"total_bill")
pal =dict(Lunch="seagreen", Dinner="gray")
g = sns.FacetGrid(tips, hue="time", palette=pal, size=5)
g.map(plt.scatter,"total_bill","tip", s=50, alpha=.7, linewidth=.5, edgecolor="white")
g.add_legend()