在背景添加网格
- plt方法
在console里执行,是交互式的,可以改变
import numpy as np
import matplotlib.pyplot as plt
y = np.arange(1, 5)
plt.plot(y, y**2)
plt.grid(True)#生成网格
# 交互式,可以改变网格颜色、取消网格等等
plt.show()
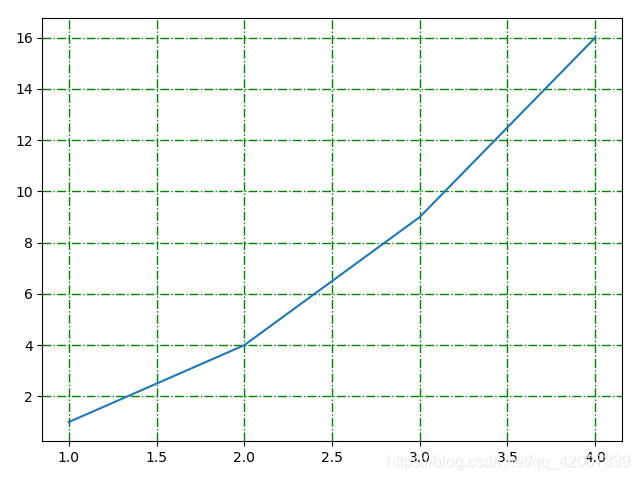
- 面向对象法
正常执行,一旦生成除非重新编译不可改变
import numpy as np
import matplotlib.pyplot as plt
y = np.arange(1, 5)
fig = plt.figure()
ax = fig.add_subplot(111)
plt.plot(y, y**2)
ax.grid(True, color='g', linestyle='-.', linewidth=1)
plt.show()