场景
- 在信息抽取中,词语在文章中各个位置具有不同的权重。
- 把文章简单分为前中后三部分,某词出现在前面时有较大概率是关键词,出现在其它位置时有较小概率是关键词
- 例如某【日期类】实体在结尾出现的概率较大,故该实体结尾权重较高,在开头和中间出现的词极可能是伪实体
- 通常文章信息权重排序:开头>结尾>中间
步骤
- 统计实体在文章出现的位置
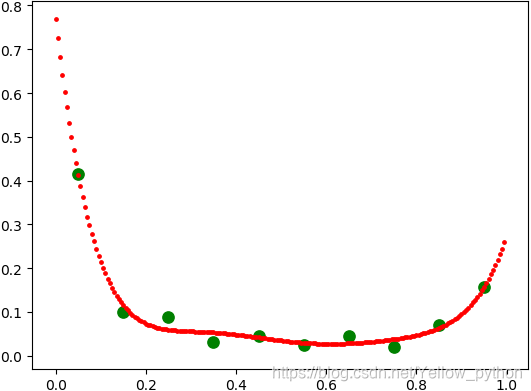
- 计算位置密度
- 计算位置权重(https://blog.csdn.net/Yellow_python/article/details/104504629)
from sklearn.gaussian_process import GaussianProcessRegressor
from matplotlib import pyplot as mp
from seaborn import swarmplot
from segment import lcut  # from jieba import cut


def swarm_plot(x, size=0):
    """蜂群图"""
    s = size if size > 0 else (2400/len(x))**.7  # 根据点数调点大小
    print(len(x));swarmplot(y=x, size=s);mp.show()  # 蜂群图


def get_position(xy, judge=lambda a, b: a == b, v=-1):
    """统计实体在文章出现的位置【排行率[0,1)】"""
    positions = []
    for text, entity in xy:
        words = lcut(text)
        length = len(words)
        for i, word in enumerate(words):
            if judge(word, entity):
                positions.append(i / length)
    if v >= 0:  # visualize: size
        swarm_plot(positions, v)
    return positions


def discretize(positions, n=10, v=0):
    """计算位置密度(数据离散化)"""
    xy = [[i / n, 0] for i in range(n-1, -1, -1)]
    for i in positions:
        for j in xy:
            if i >= j[0]:
                j[1] += 1
                break
    total = len(positions)
    y = [i[1] / total for i in xy]  # [0,1)
    x = [[i[0] + .5/n] for i in xy]  # 右移1/2n
    if v > 0:  # visualize: length of bar
        for i in range(n):
            print('%2d' % (x[i][0]*100), '#'*int(y[i]*v), y[i], sep=' '*3)
    return x, y


def train(x, y):
    """根据位置密度训练位置权重"""
    model = GaussianProcessRegressor().fit(x, y)
    a = [[i / 10] for i in range(11)]
    b = model.predict(a)
    print(a, [round(i, 3) for i in b], sep='\n')
    return model


def ensemble(xy, judge=lambda a, b: a == b):
    """全程可视化"""
    positions = get_position(xy, judge, 0)
    x, y = discretize(positions, 10, 100)
    model = train(x, y)
    w = [[i / 200] for i in range(201)]
    z = model.predict(w)
    mp.scatter(x, y, s=66, color='g')
    mp.scatter(w, z, s=6, color='r')
    mp.show()


if __name__ == '__main__':
    _p=[.02,.03,.05,.91,.05,.06,.01,.06,.02,.13,.1,.27,.95,.02,.06,.13,.82,.89,.34,.2,.95,.02,.13,.96,.03,.05,.23,
    .96,.98,.03,.98,.08,.15,.2,.93,.09,.29,.9,.03,.03,.0,.95,.43,.05,.06,.86,.07,.21,.6,.5,.04,.33,.05,.08,.02,.5,
    .68,.03,.36,.38,.41,.71,.02,.98,.0,.42,.01,.16,.01,.09,.03,.36,.17,.03,.44,.94,.07,.42,.9,.04,.87,.05,.45,.99,
    .03,.04,.08,.9,.11,.95,.06,.26,.06,.87,.04,.04,.09,.09,.91,.95,.06,.07,.09,.95,.98,.1,.84,.03,.14,.07,.03,.17,
    .03,.03,.98,.05,.94,.02,.23,.87,.11,.8,.91,.06,.98,.04,.21,.29,.24,.83,.11,.27,.11,.41,.87,.01,.02,.1,.88,.03,
    .22,.11,.96,.03,.13,.18,.27,.94,.03,.18,.1,.39,.07,.27,.93,.07,.1,.82,.05,.25,.07,.4,.79,.8,.05,.06,.05,.6,.9,
    .3,.1,.93,.04,.99,.06,.05,.88,.92,.02,.16,.94,.03,.03,.1,.22,.26,.9,.02,.05,.03,.03,.98,.04,.06,.6,.04,.04,.5,
    .89,.26,.84,.05,.12,.19,.2,.3,.06,.11,.44,.9,.2,.9,.06,.95,.13,.4,.96,.01,.09,.04,.05,.05,.07,.07,.08,.03,.02,
    .1,.02,.27,.29,.92,.03,.24,.28,.91,.09,.64,.95,.03,.95,.02,.04,.02,.21,.15,.29,.6,.03,.62,.04,.27,.31,.85,.08,
    .02,.99,.01,.01,.86,.04,.83,.03,.99,.01,.02,.4,.59,.66,.56,.98,.05,.5,.89,.03,.96,.98,.02,.97,.01,.03,.68,.05,
    .99,.04,.6,.8,.22,.0,.65,.04,.11,.95,.04,.9,.46,.99,.04,.22,.48,.03,.06,.08,.02,.19,.83,.04,.02,.15,.94]#all<1
    _x, _y = discretize(_p, v=100)
    _w = [[i / 200] for i in range(201)]
    mp.scatter(_x, _y, s=66, color='g')
    mp.scatter(_w, train(_x, _y).predict(_w), s=6, color='r')
    mp.show()
统计实体在文章出现的位置
def get_position(xy, judge=lambda a, b: a == b, lcut=tk.lcut, v=-1):
    """统计实体在文章出现的位置【排行率[0,1)】"""
    positions = []
    for text, entity in xy:
        words = lcut(text)
        length = len(words)
        for i, word in enumerate(words):
            if judge(word, entity):
                positions.append(i / length)
    if v >= 0:  # visualize: size
        swarmplot(positions, v)
    return positions
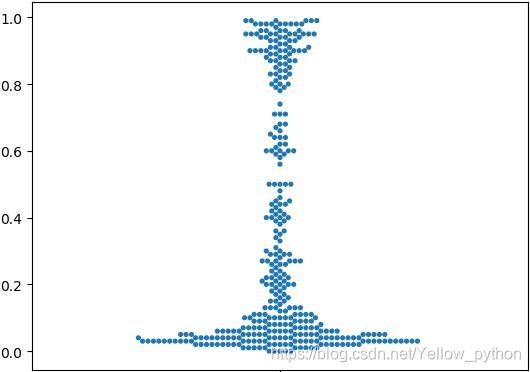
如图示:实体在开头和结尾出现频数较高,在中间出现频数较低。
计算位置密度
def discretize(positions, n=10, v=0):
    xy = [[i / n, 0] for i in range(n-1, -1, -1)]
    for i in positions:
        for j in xy:
            if i >= j[0]:
                j[1] += 1
                break
    total = len(positions)
    y = [i[1] / total for i in xy]  # [0,1)
    x = [[i[0] + .5/n] for i in xy]  # 右移1/2n
    if v > 0:  # visualize: length of bar
        for i in range(n):
            print('%2d' % (x[i][0]*100), '#'*int(y[i]*v), y[i], sep=' '*3)
    return x, y
- 条形图
-
95 ############### 0.15669515669515668
85 ####### 0.07122507122507123
75 # 0.019943019943019943
65 #### 0.045584045584045586
55 ## 0.02564102564102564
45 #### 0.045584045584045586
35 ### 0.03133903133903134
25 ######## 0.08831908831908832
15 ######### 0.09971509971509972
5 ######################################### 0.41595441595441596
计算位置权重
class Model:
    """根据位置密度计算位置权重"""
    def __init__(self, model=None):
        self.model = GaussianProcessRegressor() if model is None else model

    def fit(self, x, y, v=False):
        self.model.fit(x, y)
        if v:  # visualize: scatter
            from matplotlib import pyplot as mp
            w = [[i / 200] for i in range(200)]
            z = self.model.predict(w)
            mp.scatter(x, y, s=66, color='g')
            mp.scatter(w, z, s=6, color='r')
            mp.show()

    def predict(self, position):
        """获取位置权重"""
        return self.model.predict([[position]])[0]
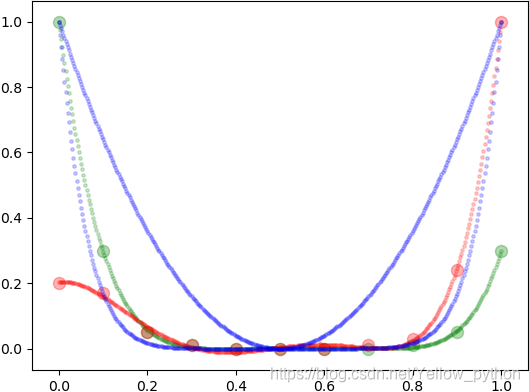
预设免训练模型
from sklearn.gaussian_process import GaussianProcessRegressor

X = [[0], [.1], [.2], [.3], [.4], [.5], [.6], [.7], [.8], [.9], [1]]
Y1 = [[1], [.3], [.05], [.01], [0], [0], [0], [0], [.01], [.05], [.3]]
Y2 = [[.2], [.17], [.05], [.01], [0], [0], [0], [.01], [.03], [.24], [1]]


def quadratic(x, n=2):
    """start = end > middle"""
    return (2*x - 1) ** n


def g1():
    """start > end > middle"""
    return GaussianProcessRegressor().fit(X, Y1)


def g2():
    """end > start > middle"""
    return GaussianProcessRegressor().fit(X, Y2)


def scatter():
    from matplotlib import pyplot as mp
    w = [[i / 400] for i in range(401)]
    mp.scatter(X, Y1, s=75, color='g', alpha=.3)
    mp.scatter(w, g1().predict(w), s=6, color='g', alpha=.2)
    mp.scatter(X, Y2, s=75, color='r', alpha=.3)
    mp.scatter(w, g2().predict(w), s=6, color='r', alpha=.2)
    # mp.scatter([0, .5, 1], [1, 0, 1], s=75, color='b', alpha=.3)
    mp.scatter(w, [[quadratic(i[0])]for i in w], s=6, color='b', alpha=.2)
    # mp.scatter(w, [[quadratic(i[0], 4)]for i in w], s=6, color='b', alpha=.2)
    # mp.scatter(w, [[quadratic(i[0], 6)]for i in w], s=6, color='b', alpha=.2)
    mp.scatter(w, [[quadratic(i[0], 8)]for i in w], s=6, color='b', alpha=.2)
    mp.show()


if __name__ == '__main__':
    scatter()
"""https://blog.csdn.net/Yellow_python/article/details/104580509"""
from sklearn.gaussian_process import GaussianProcessRegressor
from segment import lcut

X = [[0], [.1], [.2], [.3], [.4], [.5], [.6], [.7], [.8], [.9], [1]]
Y = [[1], [.2], [.04], [.02], [.01], [0], [0], [.01], [.03], [.1], [.5]]


class GPR:
    """高斯过程回归"""
    def __init__(self):
        self.model = GaussianProcessRegressor()

    def fit(self, x=X, y=Y):
        self.model.fit(x, y)
        return self

    def predict(self, position):
        return self.model.predict([[position]])[0]

    def extract(self, text, judge):
        words = lcut(text)
        le = len(words) - 1
        entities = [(self.predict(i/le), words[i]) for i in range(le+1) if judge(words[i])]
        return entities


class Model:
    """(2x-1)^8"""
    @staticmethod
    def predict(position):
        return (2 * position - 1) ** 8

    def extract(self, text, judge):
        words = lcut(text)
        le = len(words) - 1
        entities = [(self.predict(i/le), words[i]) for i in range(le+1) if judge(words[i])]
        return entities