1、甘特图
前台View中代码


 1 <lvc:CartesianChart Grid.Row="2" Zoom="None" Margin="0,40">
 2     <lvc:CartesianChart.AxisX>
 3         <!--LabelFormatter-轴坐标标签样式;MinValue-轴坐标起点;MaxValue-轴坐标终点-->
 4         <lvc:Axis Foreground="White" FontSize="14" FontFamily="Source Han Serif CN"
 5                   LabelFormatter="{Binding Path=Formatter}"
 6                   MinValue="{Binding Path=From, Mode=TwoWay}"
 7                   MaxValue="{Binding Path=To, Mode=TwoWay}">
 8             <!--Separator-坐标平面分割线 StrokeDashArray-分割线虚线间隔-->
 9             <lvc:Axis.Separator>
10                 <lvc:Separator Stroke="#33ffffff" StrokeDashArray="5"/>
11             </lvc:Axis.Separator>
12         </lvc:Axis>
13     </lvc:CartesianChart.AxisX>
14     <lvc:CartesianChart.AxisY>
15         <!--Labels-轴坐标标签列表-->
16         <lvc:Axis Foreground="White" FontSize="14" FontFamily="Source Han Serif CN"
17                   Labels="{Binding Path=Labels}">
18             <lvc:Axis.Separator>
19                 <lvc:Separator Stroke="#33ffffff" StrokeDashArray="5"/>
20             </lvc:Axis.Separator>
21         </lvc:Axis>
22     </lvc:CartesianChart.AxisY>
23     <!--Series-数据序列-->
24     <lvc:CartesianChart.Series>
25         <!--RowSeries-数据序列按行显示 LabelPosition-数据标签位置 DataLabels-是否显示数据标签 Values-数据序列值-->
26         <lvc:RowSeries Foreground="White" FontSize="9" FontFamily="Source Han Serif CN"
27                        Fill="#008bd3" LabelsPosition="Top" DataLabels="False" Values="{Binding Path=Values}"/>
28     </lvc:CartesianChart.Series>
29 </lvc:CartesianChart>
后台ViewModel代码
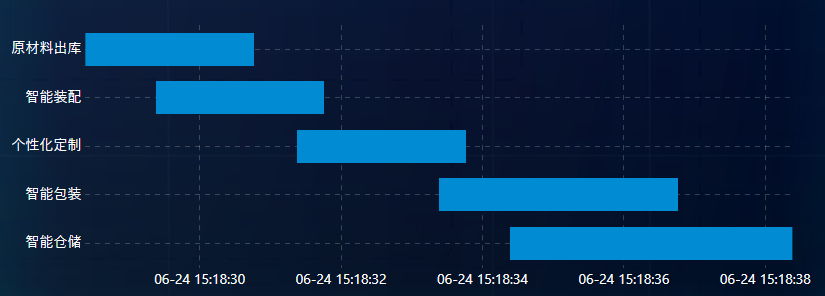
 1 private double _from;
 2 private double _to;
 3 private Func<double, string> _formatter;
 4 private string[] _labels;
 5 private ChartValues<GanttPoint> _values;
 6 public double From { get { return _from; } set { _from = value; NotifyOfPropertyChange(() => From); } }
 7 public double To { get { return _to; } set { _to = value; NotifyOfPropertyChange(() => To); } }
 8 public Func<double, string> Formatter { get { return _formatter; } set { _formatter = value; NotifyOfPropertyChange(() => Formatter); } }
 9 public string[] Labels { get { return _labels; } set { _labels = value; NotifyOfPropertyChange(() => Labels); } }
10 public ChartValues<GanttPoint> Values { get { return _values; } set { _values = value; NotifyOfPropertyChange(() => Values); } }
11
12 public void ShowGanttChart()
13 {
14     var now = DateTime.Now;
15
16     Values = new ChartValues<GanttPoint>
17     {
18         new GanttPoint(now.Ticks, now.AddSeconds(2).Ticks),
19         new GanttPoint(now.AddSeconds(1).Ticks, now.AddSeconds(3).Ticks),
20         new GanttPoint(now.AddSeconds(3).Ticks, now.AddSeconds(5).Ticks),
21         new GanttPoint(now.AddSeconds(5).Ticks, now.AddSeconds(8).Ticks),
22         new GanttPoint(now.AddSeconds(6).Ticks, now.AddSeconds(10).Ticks)
23     };
24
25     Formatter = value => new DateTime((long)value).ToString("MM-dd HH:mm:ss");
26
27     Labels = new[]
28     {
29         "原材料出库", "智能装配","个性化定制", "智能包装", "智能仓储"
30     };
31     From = _values.First().StartPoint;
32     To = _values.Last().EndPoint;
33 }
效果图
2、