Logstash具有一个有趣的功能,称为翻译过滤器 (translate filter)。 翻译过滤器用于根据字典或查找文件过滤传入数据中的特定字段。 然后,如果输入字段与字典查找文件中的条目匹配,则它将执行操作,例如,将字段添加到数据或发送电子邮件。这个和我们之前介绍的数据丰富是一样的。
一个简单的用例
也许你正在从Twitter索引数据,并想知道用户何时在其推文中提及某些特定单词。 创建一个被认为很有趣的单词列表。 每次在推文中提及该单词时,你都可以在数据中添加一个字段,以将数据标记为“interesting”。 现在,你可以轻松地在 Kibana 中制作一个图表,仅显示标记为“interesting”的推文。
在处理安全事件的日志文件时,这也是一个很好的功能,因为您可能希望对日志文件中的某些文件哈希或列入黑名单的IP发出警报。 在开始之前,我们先来看一个使用转换过滤器的 Logstash 配置文件的结构。
配置
你可以使用翻译过滤器的不同方式。 我将在下面内讨论其中两种方法。 翻译部分位于配置文件的过滤器部分。 见下文:
input {
  stdin {
    codec => json
    }
}

filter {
  translate {
    # Your translate filter specific options go here.
     ...
  }
  ...
}

output {
  stdout {
     codec => plain {
          charset => "ISO-8859-1"
    }
  }

  elasticsearch {
    index => "nginx_json_elk_example"
    document_type => "logs"
  }
}
现在你知道将与转换过滤器相关的选项放在何处。 我们需要在传入数据中定义一个要对其执行转换过滤器的字段。 在下面的示例中,我们正在 HTTP 代理服务器的日志中查看目标IP。 通过以这种方式在转换过滤器中指定我们的字段,我们可以检查所有传入日志数据上的目标IP。
translate {
  field => "dst_ip"
  ...
}
字典条目
你可以通过两种方法定义字典条目,以使翻译过滤器参考传入的数据。 他们是:
Dictionary configutation 选项
你可以在其中定义直接在配置文件中表示的值。 当你有少量数据表示不经常更改时,这很有用,比如
# Web server related ports and what they represent. Just an example.
dictionary => [     "80", "http",    "443", "https",    "8080", "http-alt"    ]
Dictionary lookup 文件
这对于大型数据集很有用,尤其是需要经常更新的数据。 例如,这对于包含许多条目并且经常每天更新的IP或电子邮件黑名单之类的东西很有用。比如:
# This is our Logstash configuration
translate {
  field => "agent"
  destination => "good_bot"
  dictionary_path => '/tmp/crawler_bot_list.yaml'
}
这是 yaml 文件的样子:
"Exalead Mozilla/5.0 (compatible; Exabot/3.0 (BiggerBetter); +http://www.exabot.com/go/robot)": "YES"
"Alexa Mozilla/5.0 (compatible; alexa site audit/1.0; +http://www.alexa.com/help/webmasters; [email protected])": "YES"
"Grapeshot UK Mozilla/5.0 (compatible; GrapeshotCrawler/2.0; +http://www.grapeshot.co.uk/crawler.php)": "YES"
"Facebook facebookexternalhit/1.0 (+http://www.facebook.com/externalhit_uatext.php)": "YES"
"Archive.org Mozilla/5.0 (compatible; archive.org_bot +http://www.archive.org/details/archive.org_bot)": "YES"
"Shopstyle.com ShopStyle Server/1.0 (ShopStyle Server Agent; http://www.shopstyle.com/; [email protected]))": "YES"
"jobrapido.com Mozilla/5.0 (compatible; Jobrapido/1.1; +http://www.jobrapido.com)": "YES"
通过实际示例更容易理解这两种类型的用途。对于这些示例,我将制作一个所谓的 IP 黑名单。这些 IP 实际上并未被列入黑名单,我只是获取了数据中已经存在的 IP,并根据这些IP创建了虚假的黑名单。该示例将说明如何检查 nginx 日志中是否有列入黑名单的IP是否击中了您的网络服务器。
首先创建字典文件或 yaml 文件。我们将检查此文件中的IP,以防传入 IP 访问Web服务器。关于该主题的文章还很少。但是,你可以通过以下 github 存储库在安全上下文中使用 ELK 堆栈查看一些不错的配置:https://github.com/TravisFSmith/MyBroElk。看一下logstash.conf。它将帮助您了解如何使用Logstash转换过滤器。
现在回到我们的例子。这是此示例的黑名单文件的样子:
(将这些内容放在名称为/tmp/blacklisted_ip.yaml的文件中)
"216.46.173.126": "true"
"180.179.174.219": "true"
"204.77.168.241": "true"
"65.39.197.164": "true"
"80.91.33.133": "true"
"84.208.15.12": "true"
"74.125.60.158": "true"
我们将在 remote_ip 字段中检查这些特定 IP 的传入日志数据。 如果我们在 remote_ip 字段中看到其中一个 IP,则将在文档中添加一个值为 true”的新字段 blacklisted_ip。 这是我们的配置:
logstash_translate.conf
input {
  stdin {
    codec => json
  }
}

filter {
  date {
    match => ["time", "dd/MMM/YYYY:HH:mm:ss Z" ]
    locale => en
  }

  geoip {
    source => "remote_ip"
    target => "geoip"
  }

  translate {
    field => "remote_ip"
    destination => "blacklisted_ip"
    dictionary_path => '/tmp/blacklisted_ip.yaml'
  }

  grok {
    match => [ "request" , "%{WORD:request_action} %{DATA:request1} HTTP/%{NUMBER:http_version}" ]
  }
}

output {
  stdout {
    codec => plain {
      charset => "ISO-8859-1"
    }
  }

  elasticsearch {
    index => "logstash-nginx"
  }
}
这利用了一些官方的 Elasticsearch 示例文件。 你需要先下载日志文件,然后才能尝试新的配置文件。
wget https://raw.githubusercontent.com/elastic/examples/master/Common%20Data%20Formats/nginx_json_logs/nginx_json_logs现在,我们可以在日志文件上运行 Logstash。 确保你创建了字典查找文件 /tmp/blacklisted_ip.yaml
sudo cat nginx_json_logs | sudo ./bin/logstash -f ~/data/translate/logstash_translate.conf上面的 logstash_translate.conf 的路径依赖于你的路径需要重新修改。我们在 Logstash 的 console 中可以看出来:

你可能会认为 “blacklisted_ip” 字段不是很有用。 您需要在 Kibana 进行一些尝试才能看到其价值。 打开 Kibana 并创建一个名为 “logstash-nginx-blacklisted” 的索引。 在发现选项卡中搜索:blacklisted_ip:true。
通过如下命令:
GET _cat/indices我们可以看到一个新的叫做 logstash_nginx 的索引出现了:
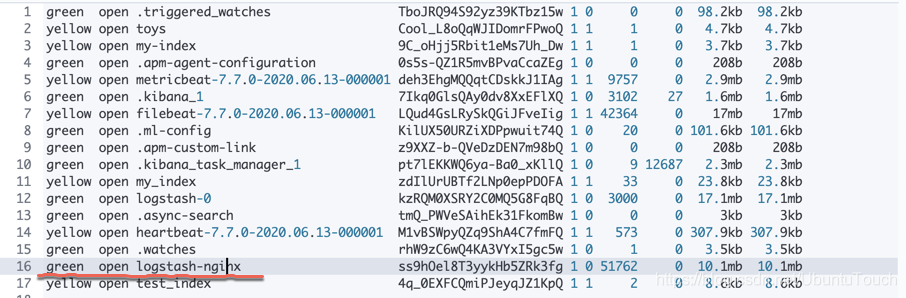
我们为它创建一个index pattern:

我们在 Discover 中可以看到:

在上面我们可以看出来,有很多的文档具有 blacklisted_ip 为 true。
我们可以更进一步对这些 remote_ip 进行统计:

在上面,我们使用了 yaml 文件作为 dictionary_path。根据文档,我们实际上也可以使用 csv 格式的文档:
blacklisted_ip.csv
"216.46.173.126","true"
"180.179.174.219","true"
"204.77.168.241","true"
"65.39.197.164","true"
"80.91.33.133","true"
"84.208.15.12","true"
"74.125.60.158","true"
根据文档的要求,CSV格式需要两列,第一列用作原始文本(查找键),第二列作为翻译。
在这种情况下,我们把 Logstash 的配置文件修改为:
logstash_translate_csv.conf
input {
  stdin {
    codec => json
  }
}

filter {
  date {
    match => ["time", "dd/MMM/YYYY:HH:mm:ss Z" ]
    locale => en
  }

  geoip {
    source => "remote_ip"
    target => "geoip"
  }

  translate {
    field => "remote_ip"
    destination => "blacklisted_ip"
    dictionary_path => '/Users/liuxg/data/translate/blacklisted_ip.csv'
  }

  grok {
    match => [ "request" , "%{WORD:request_action} %{DATA:request1} HTTP/%{NUMBER:http_version}" ]
  }
}

output {
  stdout {
    codec => rubydebug
  }

  elasticsearch {
    index => "logstash-nginx"
  }
}
重新启动 Logstash,我们将看到同样的结果。
丰富多个字段
在上面的演示中,我们发现,我们只能丰富一个字段。在实际的使用中,假如我们想丰富多个字段,那该怎么办呢?
我们重新修改之前的 blacklisted_ip.yaml 文件。
blacklisted_ip.yaml
"216.46.173.126": "true,good"
"180.179.174.219": "true,bad"
"204.77.168.241": "true,great"
"65.39.197.164": "true,teriffic"
"80.91.33.133": "true,fabulous"
"84.208.15.12": "true,excellent"
"74.125.60.158": "true,wonderful"
在上面,我们把除 IP 地址以外的数据写成一个字符串的模样。每当 translate 成功后,我们就会获取这个字符串。我们也同时修改 Logstash 的配置文件:
logstash_translate.conf
input {
  stdin {
    codec => json
  }
}

filter {
  date {
    match => ["time", "dd/MMM/YYYY:HH:mm:ss Z" ]
    locale => en
  }

  geoip {
    source => "remote_ip"
    target => "geoip"
  }

  translate {
    field => "remote_ip"
    destination => "csv_data"
    dictionary_path => '/Users/liuxg/data/translate/blacklisted_ip.yaml'
  }

  if ("" in [csv_data]) {
    csv {
      source => csv_data
      separator => ","
      columns => [ "blacklisted_ip", "comments"]
    }
  }

  grok {
    match => [ "request" , "%{WORD:request_action} %{DATA:request1} HTTP/%{NUMBER:http_version}" ]
  }
}

output {
  stdout {
    codec => rubydebug
  }

  elasticsearch {
    index => "logstash-nginx"
  }
}
在上面,我们在 translate 过滤器中,把数据写入到 csv_data 这个字段,并在下面使用 csv 过滤器来对数据进行分析。
我们重新启动 Logstash:
sudo cat nginx_json_logs | sudo ./bin/logstash -f ~/data/translate/logstash_translate.conf 最后,我们在 Discover 中查询:

我们会发现一个增加的字段 comments。