using System;namespace Wpf.CartesianChart.Using_DateTime
{publicclassDateModel{publicSystem.DateTime DateTime {get;set;}publicdouble Value {get;set;}}}
后台:
using System;using System.Windows.Controls;using System.Windows.Media;using LiveCharts;using LiveCharts.Configurations;using LiveCharts.Wpf;namespace Wpf.CartesianChart.Using_DateTime
{publicpartialclassDateTime:UserControl{publicDateTime(){InitializeComponent();var dayConfig = Mappers.Xy<DateModel>().X(dayModel =>(double) dayModel.DateTime.Ticks/TimeSpan.FromHours(1).Ticks).Y(dayModel => dayModel.Value);//Notice you can also configure this type globally, so you don't need to configure every//SeriesCollection instance using the type.//more info at http://lvcharts.net/App/Index#/examples/v1/wpf/Types%20and%20Configuration
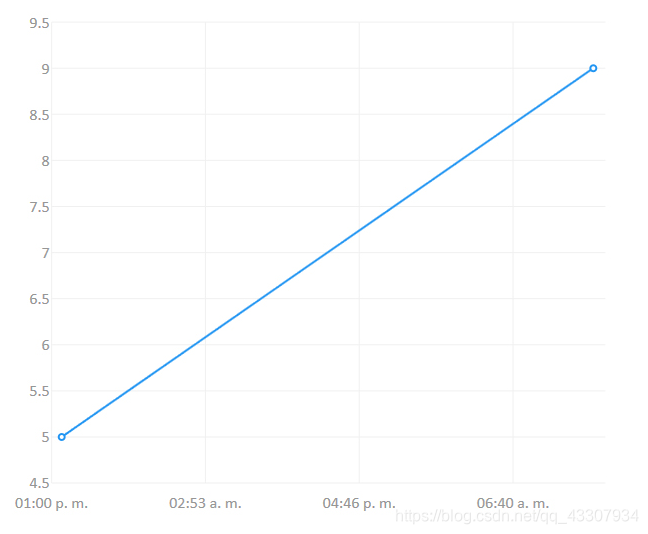
Series =newSeriesCollection(dayConfig){newLineSeries{
Values =newChartValues<DateModel>{newDateModel{
DateTime = System.DateTime.Now,
Value =5},newDateModel{
DateTime = System.DateTime.Now.AddHours(2),
Value =9}},
Fill = Brushes.Transparent
},newColumnSeries{
Values =newChartValues<DateModel>{newDateModel{
DateTime = System.DateTime.Now,
Value =4},newDateModel{
DateTime = System.DateTime.Now.AddHours(1),
Value =6},newDateModel{
DateTime = System.DateTime.Now.AddHours(2),
Value =8}}}};
Formatter =value=>newSystem.DateTime((long)(value*TimeSpan.FromHours(1).Ticks)).ToString("t");
DataContext =this;}public Func<double,string> Formatter {get;set;}publicSeriesCollection Series {get;set;}}}
var dayConfig = Mappers.Xy<DateModel>().X(dateModel => dateModel.DateTime.Ticks/TimeSpan.FromHours(1).Ticks).Y(dateModel => dateModel.Value);//and the formatter
Formatter =value=>newDateTime((long)(value*TimeSpan.FromHours(1).Ticks)).ToString("t");
下一组示例显示了如何在许多时间间隔内配置图表的比例
//Every 15 minutesvar dayConfig = Mappers.Xy<DateModel>().X(dateModel => dateModel.DateTime.Ticks/TimeSpan.FromMinutes(15).Ticks).Y(dateModel => dateModel.Value);//and the formatter
Formatter =value=>newDateTime((long)(value*TimeSpan.FromMinutes(15).Ticks)).ToString("t");//Daysvar dayConfig = Mappers.Xy<DateModel>().X(dateModel => dateModel.DateTime.Ticks/TimeSpan.FromDays(1).Ticks).Y(dateModel => dateModel.Value);//and the formatter
Formatter =value=>newDateTime((long)(value*TimeSpan.FromDays(1).Ticks)).ToString("d");//Months//30.44 is the average days in a solar yearvar dayConfig = Mappers.Xy<DateModel>().X(dateModel => dateModel.DateTime.Ticks/(TimeSpan.FromDays(1).Ticks*30.44)).Y(dateModel => dateModel.Value);//and the formatter
Formatter =value=>newDateTime((long)(value*TimeSpan.FromDays(1).Ticks*30.44)).ToString("M");//Years//365.2425 is the days in a solar yearvar dayConfig = Mappers.Xy<DateModel>().X(dateModel => dateModel.DateTime.Ticks/(TimeSpan.FromDays(1).Ticks*365.2425)).Y(dateModel => dateModel.Value);//and the formatter
Formatter =value=>newDateTime((long)(value*TimeSpan.FromDays(1).Ticks*365.2425)).ToString("yyyy");