opencv定位十字交叉点(python)
我的个人博客
https://ximikang.icu
1. 主体思路
如果有更好的思路希望大佬们可以提出
要处理的图片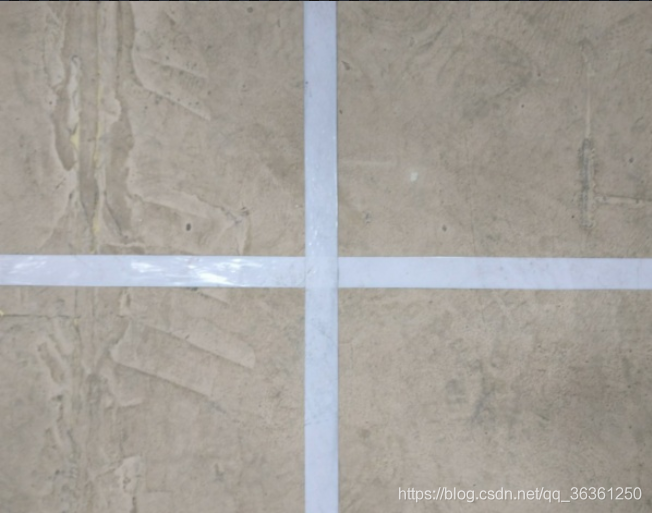
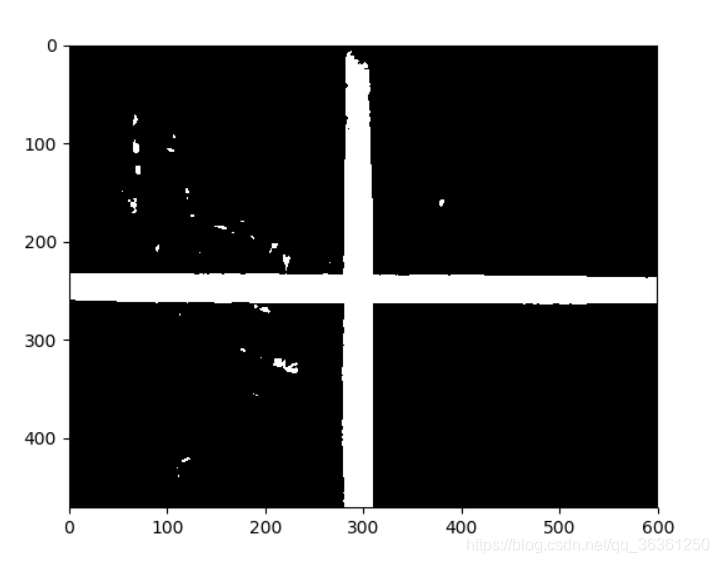
- 首先将图像进行常规处理,讲图像
灰度处理后二值化
在区域的时候发现照片中的区域很相似,但是看到图片的直方图后可以看到基本是近似的双峰,所以说可以采用Otsu’s二值化,来进行二值化,最后的结果也还可以。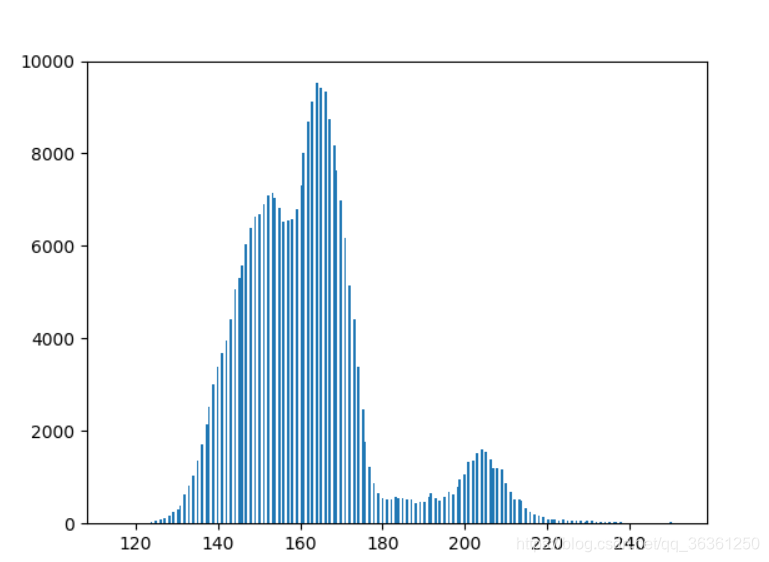
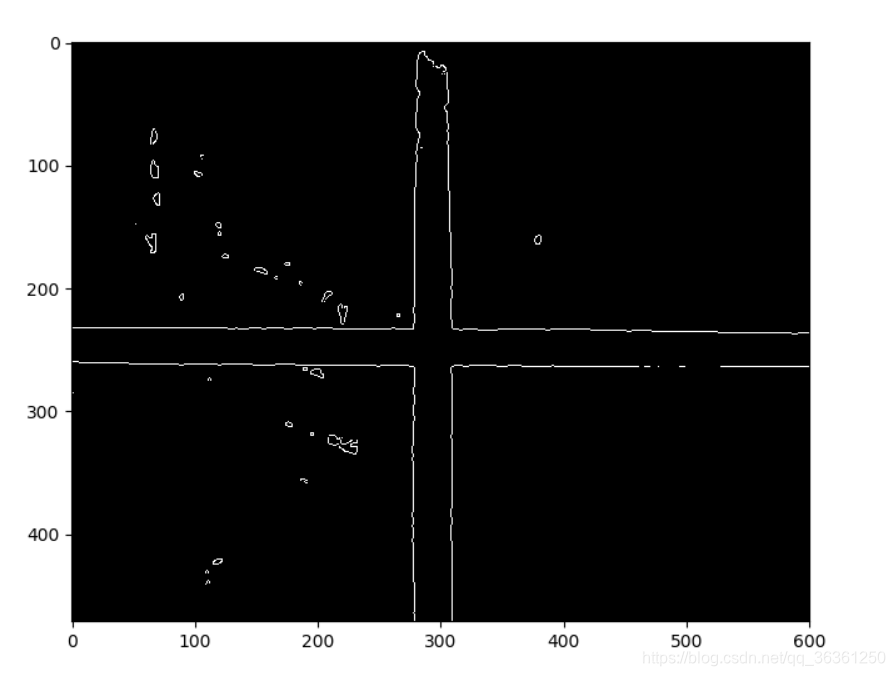
-然后对图片进行轮廓检测使用canny()得到大概的轮廓
- 然后也就是这个程序的关键,直接使用HoughLines(),但是会取到很多的直线,可以调节阈值来取数量,但是还是会有重复的线条,最后使用一个自建函数,来清除多余的线条,讲rho和theta值比较相似或者在一定的范围内的线条归结为一条线,也可以求平均值,代码中使用的是取了一条直线,最后也就是会得到四条直线。
- 为了求出四个交点,判断出横竖的直线,根据下面的方程联立求解,得到交点
a = np.array([
                    [np.cos(l1[1]), np.sin(l1[1])],
                    [np.cos(l2[1]), np.sin(l2[1])]
                ])
                b = np.array([l1[0],l2[0]])
                points.append(np.linalg.solve(a, b))
-最后的中心点也就是求平均值。标记出中心点。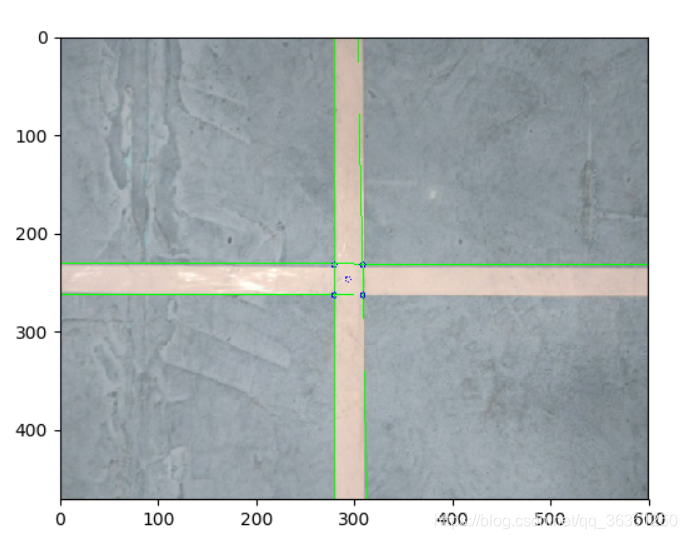
程序
import cv2
import numpy as np
import matplotlib.pyplot as plt


def cleanlines(lines):
    #清除重复的线条
    for lineindex, line in enumerate(lines):
        if line[0]<0:
            lines[lineindex][0] = -line[0]
            lines[lineindex][1] = line[1]-np.pi
    newlines = []
    newlines.append(lines.pop(5))
    for line in lines:
        flag = 0
        for newline in newlines:
            if((abs(line[0]-newline[0])<10)&(abs(line[1]-newline[1])<0.1)):
                flag = 1
        if(flag==0):
            newlines.append(line)
    return newlines

def IntersectionPoints(lines):
    #求出交点
    points = []
    if(len(lines)==4):
        horLine = []
        verLine = []
        for line in lines:
            if((line[1]>(0-0.1))&(line[1]<(0+0.1))):
                horLine.append(line)
            else:
                verLine.append(line)
        print(horLine)
        for l1 in horLine:
            for l2 in verLine:
                a = np.array([
                    [np.cos(l1[1]), np.sin(l1[1])],
                    [np.cos(l2[1]), np.sin(l2[1])]
                ])
                b = np.array([l1[0],l2[0]])
                points.append(np.linalg.solve(a, b))
        return points
    else:
        print("the number of lines error")

img = cv2.imread('mid.jpg')
img_gray = cv2.cvtColor(img, cv2.COLOR_BGR2GRAY)
ret, im2 = cv2.threshold(img_gray, 0, 255, cv2.THRESH_BINARY+cv2.THRESH_OTSU)
#plt.imshow(img_gray,plt.cm.gray)
#plt.imshow(im2,plt.cm.gray)


gimg = cv2.GaussianBlur(img_gray, (5, 5), 0)
gret, gim2 = cv2.threshold(gimg, 0, 255, cv2.THRESH_BINARY+cv2.THRESH_OTSU)
#plt.imshow(gim2, plt.cm.gray)
edges = cv2.Canny(gim2, 45,135)


minLineLength = 10
maxLineGap = 5
lines = cv2.HoughLines(edges, 1, np.pi/180, 120)
lines = [line[0] for line in lines.tolist()]
lines = cleanlines(lines)
points = IntersectionPoints(lines)
for line in lines:
    rho, theta = line
    print(rho, theta)
    a = np.cos(theta)
    b = np.sin(theta)
    x0 = a*rho
    y0 = b*rho
    x1 = int(x0 + 2000*(-b))
    y1 = int(y0 + 2000*(a))
    x2 = int(x0 - 2000*(-b))
    y2 = int(y0 - 2000*(a))
    cv2.line(img,(x1, y1), (x2, y2), (0, 255, 0), 1)


for point in points:
    cv2.circle(img, (int(point[0]),int(point[1])), 3, (0,0,255))
midx = np.mean([point[0] for point in points])
midy = np.mean([point[1] for point in points])
cv2.circle(img, (int(midx), int(midy)), 3, (0,0,255))
plt.figure()
plt.imshow(img)
plt.show()