0.k-means算法
1.概念
- k-means属于无监督学习的聚类算法。
- 适用于:簇内相似性较高,簇间相似性较低。
- k个初始聚簇中心的选择会影响结果。
2.实现过程:
- 选择初始的k个聚簇中心
- 把除开聚簇中心之外的点,依次计算到每个聚簇中心向量的距离。选择距离最近的聚簇中心,加入该簇。
- 更新聚簇中心:为簇内每个点的向量的平均值。
- 循环2、3,直到到达最大迭代次数或者聚簇中心不再发生改变。
1. 导入数据集
import numpy as np
import pandas as pd

data=pd.read_csv("data/iris.csv")
t=data.iloc[:,:4]
t
| SepalLength | SepalWidth | PetalLength | PetalWidth | |
|---|---|---|---|---|
| 0 | 5.1 | 3.5 | 1.4 | 0.2 |
| 1 | 4.9 | 3.0 | 1.4 | 0.2 |
| 2 | 4.7 | 3.2 | 1.3 | 0.2 |
| 3 | 4.6 | 3.1 | 1.5 | 0.2 |
| 4 | 5.0 | 3.6 | 1.4 | 0.2 |
| ... | ... | ... | ... | ... |
| 145 | 6.7 | 3.0 | 5.2 | 2.3 |
| 146 | 6.3 | 2.5 | 5.0 | 1.9 |
| 147 | 6.5 | 3.0 | 5.2 | 2.0 |
| 148 | 6.2 | 3.4 | 5.4 | 2.3 |
| 149 | 5.9 | 3.0 | 5.1 | 1.8 |
150 rows × 4 columns
2. K-Means算法实现
class KMeans:
    """使用python实现KMeans聚类"""

    def __init__(self,k,times):
        """初始化方法:
           k:int 表示聚类的个数
           times:int 表示循环迭代的最多次数

        """
        self.k=k
        self.times=times

    def fit(self,X):

        X=np.asarray(X)
        np.random.seed(666)
        #从数组中随机选择k个点作为初始聚类中心
        self.cluster_center_=X[np.random.randint(0,len(X),self.k)]
        self.labels_=np.zeros(len(X))#初始化所有数据标签为0

        for t in range(self.times):
            for index,x in enumerate(X):
                #计算每个样本中心与聚类中心的距离
                dis=np.sqrt(np.sum((x-self.cluster_center_)**2,axis=1))
                #将最小距离的索引赋值给标签数组,索引的值就是当前节点所在的簇。取值为[0,k-1]
                self.labels_[index]=dis.argmin()#dis.argmin()取值为[0,k-1]

            #循环遍历每一个簇
            for i in range(self.k):
                #计算每个簇内所有点的均值,跟新聚类中心
                self.cluster_center_[i]=np.mean(X[self.labels_==i],axis=0)

    def predict(self,X):
        """预测样本属于哪一个簇"""
        X=np.asarray(X)
        result=np.zeros(len(X))
        for index ,x in enumerate(X):
            #计算样本到每个聚类中心的距离
            dis=np.sqrt(np.sum((x-self.cluster_center_)**2,axis=1))
            #找到距离最近的聚类中心,划分类别
            result[index]=dis.argmin()

        return result
3. 创建kmeans对象,进行分类
kmeans=KMeans(3,50)
kmeans.fit(t)

kmeans.cluster_center_
array([[6.85      , 3.07368421, 5.74210526, 2.07105263],
       [5.006     , 3.418     , 1.464     , 0.244     ],
       [5.9016129 , 2.7483871 , 4.39354839, 1.43387097]])
#查看某个簇内的所有样本数据
t[kmeans.labels_==0]
| SepalLength | SepalWidth | PetalLength | PetalWidth | |
|---|---|---|---|---|
| 52 | 6.9 | 3.1 | 4.9 | 1.5 |
| 77 | 6.7 | 3.0 | 5.0 | 1.7 |
| 100 | 6.3 | 3.3 | 6.0 | 2.5 |
| 102 | 7.1 | 3.0 | 5.9 | 2.1 |
| 103 | 6.3 | 2.9 | 5.6 | 1.8 |
| 104 | 6.5 | 3.0 | 5.8 | 2.2 |
| 105 | 7.6 | 3.0 | 6.6 | 2.1 |
| 107 | 7.3 | 2.9 | 6.3 | 1.8 |
| 108 | 6.7 | 2.5 | 5.8 | 1.8 |
| 109 | 7.2 | 3.6 | 6.1 | 2.5 |
| 110 | 6.5 | 3.2 | 5.1 | 2.0 |
| 111 | 6.4 | 2.7 | 5.3 | 1.9 |
| 112 | 6.8 | 3.0 | 5.5 | 2.1 |
| 115 | 6.4 | 3.2 | 5.3 | 2.3 |
| 116 | 6.5 | 3.0 | 5.5 | 1.8 |
| 117 | 7.7 | 3.8 | 6.7 | 2.2 |
| 118 | 7.7 | 2.6 | 6.9 | 2.3 |
| 120 | 6.9 | 3.2 | 5.7 | 2.3 |
| 122 | 7.7 | 2.8 | 6.7 | 2.0 |
| 124 | 6.7 | 3.3 | 5.7 | 2.1 |
| 125 | 7.2 | 3.2 | 6.0 | 1.8 |
| 128 | 6.4 | 2.8 | 5.6 | 2.1 |
| 129 | 7.2 | 3.0 | 5.8 | 1.6 |
| 130 | 7.4 | 2.8 | 6.1 | 1.9 |
| 131 | 7.9 | 3.8 | 6.4 | 2.0 |
| 132 | 6.4 | 2.8 | 5.6 | 2.2 |
| 134 | 6.1 | 2.6 | 5.6 | 1.4 |
| 135 | 7.7 | 3.0 | 6.1 | 2.3 |
| 136 | 6.3 | 3.4 | 5.6 | 2.4 |
| 137 | 6.4 | 3.1 | 5.5 | 1.8 |
| 139 | 6.9 | 3.1 | 5.4 | 2.1 |
| 140 | 6.7 | 3.1 | 5.6 | 2.4 |
| 141 | 6.9 | 3.1 | 5.1 | 2.3 |
| 143 | 6.8 | 3.2 | 5.9 | 2.3 |
| 144 | 6.7 | 3.3 | 5.7 | 2.5 |
| 145 | 6.7 | 3.0 | 5.2 | 2.3 |
| 147 | 6.5 | 3.0 | 5.2 | 2.0 |
| 148 | 6.2 | 3.4 | 5.4 | 2.3 |
#对数据进行预测
kmeans.predict([[6.2,2.5,5.0,2.1],[5.2,4.0,5.6,2.5],[5.0,4.0,6.0,4.0]])
array([2., 0., 0.])
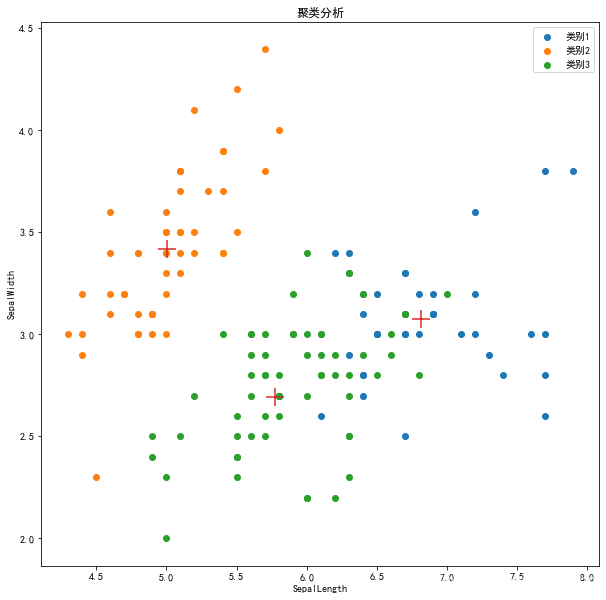
4. 进行可视化
#选取两个特征进行训练,方便进行可视化
t2=data.loc[:,"SepalLength":"SepalWidth"]
my_kmeans=KMeans(3,50)
my_kmeans.fit(t2)

import matplotlib as mpl
import matplotlib.pyplot as plt

mpl.rcParams["font.family"]="SimHei"
mpl.rcParams["axes.unicode_minus"]=False

plt.figure(figsize=(10,10))
#绘制每个类别的散点图
plt.scatter(t2[kmeans.labels_==0].iloc[:,0],t2[kmeans.labels_==0].iloc[:,1],label="类别1")
plt.scatter(t2[kmeans.labels_==1].iloc[:,0],t2[kmeans.labels_==1].iloc[:,1],label="类别2")
plt.scatter(t2[kmeans.labels_==2].iloc[:,0],t2[kmeans.labels_==2].iloc[:,1],label="类别3")
plt.scatter(my_kmeans.cluster_center_[:,0],my_kmeans.cluster_center_[:,1],marker="+",s=300)
plt.title("聚类分析")
plt.xlabel("SepalLength")
plt.ylabel("SepalWidth")
plt.legend()
<matplotlib.legend.Legend at 0x26005241308>
5. 使用sklearn包的kMeans
import numpy as np
from sklearn import datasets

iris =datasets.load_iris()

iris.feature_names
['sepal length (cm)',
 'sepal width (cm)',
 'petal length (cm)',
 'petal width (cm)']
from sklearn.cluster import KMeans
kmeans=KMeans(n_clusters=3,init='k-means++',random_state=666)
#init='k-means++'/'random'random是指随机取k个值,'k-means++'避免选择较差起始点
predict=kmeans.fit_predict(iris.data)
predict
array([1, 1, 1, 1, 1, 1, 1, 1, 1, 1, 1, 1, 1, 1, 1, 1, 1, 1, 1, 1, 1, 1,
       1, 1, 1, 1, 1, 1, 1, 1, 1, 1, 1, 1, 1, 1, 1, 1, 1, 1, 1, 1, 1, 1,
       1, 1, 1, 1, 1, 1, 0, 0, 2, 0, 0, 0, 0, 0, 0, 0, 0, 0, 0, 0, 0, 0,
       0, 0, 0, 0, 0, 0, 0, 0, 0, 0, 0, 2, 0, 0, 0, 0, 0, 0, 0, 0, 0, 0,
       0, 0, 0, 0, 0, 0, 0, 0, 0, 0, 0, 0, 2, 0, 2, 2, 2, 2, 0, 2, 2, 2,
       2, 2, 2, 0, 0, 2, 2, 2, 2, 0, 2, 0, 2, 0, 2, 2, 0, 0, 2, 2, 2, 2,
       2, 0, 2, 2, 2, 2, 0, 2, 2, 2, 0, 2, 2, 2, 0, 2, 2, 0])
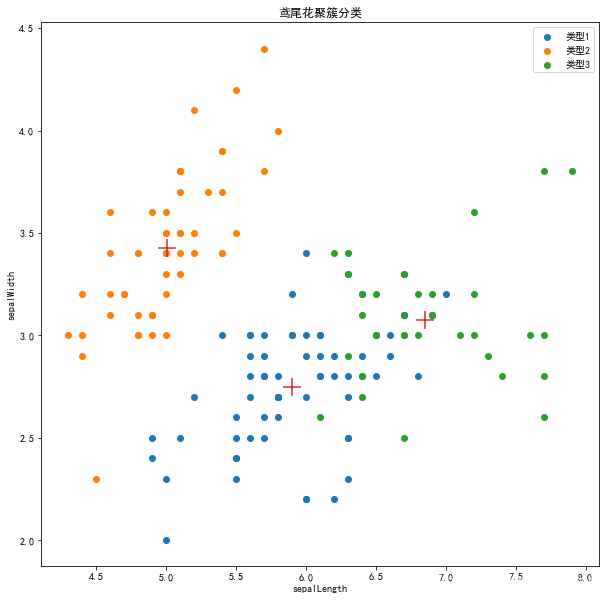
plt.figure(figsize=(10,10))
import matplotlib as mpl
import matplotlib.pyplot as plt
mpl.rcParams["font.family"]="SimHei"
mpl.rcParams["axes.unicode_minus"]=False
#将聚类结果显示
plt.scatter(iris.data[predict == 0, 0], iris.data[predict== 0, 1],label = '类型1')
#[predict == 0, 2], 类型为0的sepal length (cm)在第1的栏位,所以是0,sepal width (cm)是第2栏位,所以是1
plt.scatter(iris.data[predict == 1, 0], iris.data[predict== 1, 1], label = '类型2')
plt.scatter(iris.data[predict == 2, 0], iris.data[predict== 2, 1], label = '类型3')
plt.scatter(kmeans.cluster_centers_[:,0],kmeans.cluster_centers_[:,1],marker="+",s=300)
plt.title('鸢尾花聚簇分类')
plt.xlabel('sepalLength')
plt.ylabel('sepalWidth')
plt.legend()
<matplotlib.legend.Legend at 0x1c4d6076308>