more about Pandas入门 DataFrame的常用函数
Word Clouds教程
Prepping Data
Let’s download, import and clean our primary Canadian Immigration dataset using pandas read_excel() method for any visualization.
df_can = pd.read_excel('https://cf-courses-data.s3.us.cloud-object-storage.appdomain.cloud/IBMDeveloperSkillsNetwork-DV0101EN-SkillsNetwork/Data%20Files/Canada.xlsx',
                       sheet_name='Canada by Citizenship',
                       skiprows=range(20),
                       skipfooter=2)

print('Data downloaded and read into a dataframe!')

# clean up the dataset to remove unnecessary columns (eg. REG)
df_can.drop(['AREA','REG','DEV','Type','Coverage'], axis = 1, inplace = True)

# let's rename the columns so that they make sense
df_can.rename (columns = {

    'OdName':'Country', 'AreaName':'Continent','RegName':'Region'}, inplace = True)

# for sake of consistency, let's also make all column labels of type string
df_can.columns = list(map(str, df_can.columns))

# set the country name as index - useful for quickly looking up countries using .loc method
df_can.set_index('Country', inplace = True)

# add total column
df_can['Total'] =  df_can.sum (axis = 1)

# years that we will be using in this lesson - useful for plotting later on
years = list(map(str, range(1980, 2014)))
# print ('data dimensions:', df_can.shape)
Word Clouds
Word clouds (also known as text clouds or tag clouds) work in a simple way: the more a specific word appears in a source of textual data (such as a speech, blog post, or database), the bigger and bolder it appears in the word cloud.
Luckily, a Python package already exists in Python for generating word clouds. The package, called word_cloud was developed by Andreas Mueller. You can learn more about the package by following this link.
Let’s use this package to learn how to generate a word cloud for a given text document.
First, let’s install the package.
# install wordcloud
# !conda install -c conda-forge wordcloud==1.4.1 --yes
# ! pip install wordcloud
# import package and its set of stopwords
from wordcloud import WordCloud, STOPWORDS

print ('Wordcloud is installed and imported!')
Word clouds are commonly used to perform high-level analysis and visualization of text data. Accordinly, let’s digress from the immigration dataset and work with an example that involves analyzing text data. Let’s try to analyze a short novel written by Lewis Carroll titled Alice’s Adventures in Wonderland. Let’s go ahead and download a .txt file of the novel.
# download file and save as alice_novel.txt
!wget --quiet https://cf-courses-data.s3.us.cloud-object-storage.appdomain.cloud/IBMDeveloperSkillsNetwork-DV0101EN-SkillsNetwork/Data%20Files/alice_novel.txt

# open the file and read it into a variable alice_novel
alice_novel = open('alice_novel.txt', 'r').read()

print ('File downloaded and saved!')
File downloaded and saved!
Next, let’s use the stopwords that we imported from word_cloud. We use the function set to remove any redundant stopwords.
stopwords = set(STOPWORDS)
Create a word cloud object and generate a word cloud. For simplicity, let’s generate a word cloud using only the first 2000 words in the novel.
# instantiate a word cloud object
alice_wc = WordCloud(
    background_color='white',
    max_words=2000,
    stopwords=stopwords
)

# generate the word cloud
alice_wc.generate(alice_novel)
Awesome! Now that the word cloud is created, let’s visualize it.
# display the word cloud
plt.imshow(alice_wc, interpolation='bilinear')
plt.axis('off')
plt.show()
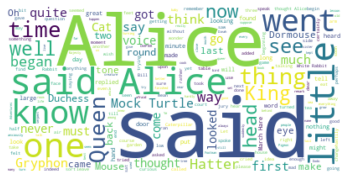
Interesting! So in the first 2000 words in the novel, the most common words are Alice, said, little, Queen, and so on. Let’s resize the cloud so that we can see the less frequent words a little better.
fig = plt.figure()
fig.set_figwidth(14) # set width
fig.set_figheight(18) # set height

# display the cloud
plt.imshow(alice_wc, interpolation='bilinear')
plt.axis('off')
plt.show()
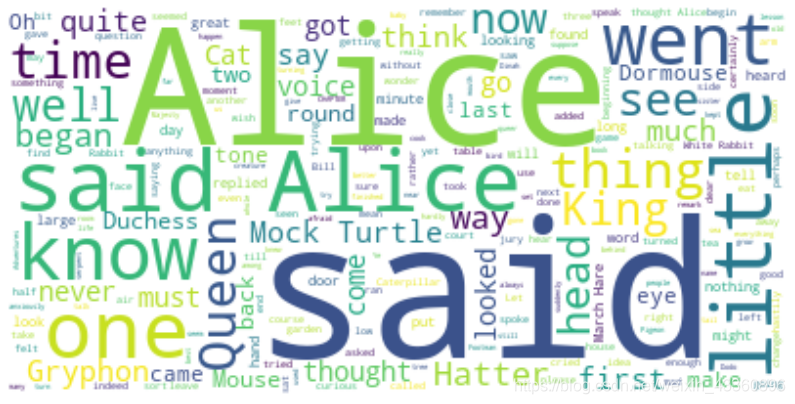
Much better! However, said isn’t really an informative word. So let’s add it to our stopwords and re-generate the cloud.
stopwords.add('said') # add the words said to stopwords

# re-generate the word cloud
alice_wc.generate(alice_novel)

# display the cloud
fig = plt.figure()
fig.set_figwidth(14) # set width
fig.set_figheight(18) # set height

plt.imshow(alice_wc, interpolation='bilinear')
plt.axis('off')
plt.show()

Excellent! This looks really interesting! Another cool thing you can implement with the word_cloud package is superimposing the words onto a mask of any shape. Let’s use a mask of Alice and her rabbit. We already created the mask for you, so let’s go ahead and download it and call it alice_mask.png.
# download image
!wget --quiet https://cf-courses-data.s3.us.cloud-object-storage.appdomain.cloud/IBMDeveloperSkillsNetwork-DV0101EN-SkillsNetwork/labs/Module%204/images/alice_mask.png

# save mask to alice_mask
alice_mask = np.array(Image.open('alice_mask.png'))

print('Image downloaded and saved!')
Image downloaded and saved!
Let’s take a look at how the mask looks like.
fig = plt.figure()
fig.set_figwidth(14) # set width
fig.set_figheight(18) # set height

plt.imshow(alice_mask, cmap=plt.cm.gray, interpolation='bilinear')
plt.axis('off')
plt.show()

Shaping the word cloud according to the mask is straightforward using word_cloud package. For simplicity, we will continue using the first 2000 words in the novel.
# instantiate a word cloud object
alice_wc = WordCloud(background_color='white', max_words=2000, mask=alice_mask, stopwords=stopwords)

# generate the word cloud
alice_wc.generate(alice_novel)

# display the word cloud
fig = plt.figure()
fig.set_figwidth(14) # set width
fig.set_figheight(18) # set height

plt.imshow(alice_wc, interpolation='bilinear')
plt.axis('off')
plt.show()

Really impressive!
Unfortunately, our immmigration data does not have any text data, but where there is a will there is a way. Let’s generate sample text data from our immigration dataset, say text data of 90 words.
what was the total immigration from 1980 to 2013?
total_immigration = df_can['Total'].sum()
total_immigration
6409153
Using countries with single-word names, let’s duplicate each country’s name based on how much they contribute to the total immigration.
max_words = 90
word_string = ''
for country in df_can.index.values:
    # check if country's name is a single-word name
    if len(country.split(' ')) == 1:
        repeat_num_times = int(df_can.loc[country, 'Total']/float(total_immigration)*max_words)
        word_string = word_string + ((country + ' ') * repeat_num_times)

# display the generated text
word_string
'China China China China China China China China China Colombia Egypt France Guyana Haiti India India India India India India India India India Jamaica Lebanon Morocco Pakistan Pakistan Pakistan Philippines Philippines Philippines Philippines Philippines Philippines Philippines Poland Portugal Romania '
We are not dealing with any stopwords here, so there is no need to pass them when creating the word cloud.
# create the word cloud
wordcloud = WordCloud(background_color='white').generate(word_string)

print('Word cloud created!')
Word cloud created!
# display the cloud
fig = plt.figure()
fig.set_figwidth(14)
fig.set_figheight(18)

plt.imshow(wordcloud, interpolation='bilinear')
plt.axis('off')
plt.show()
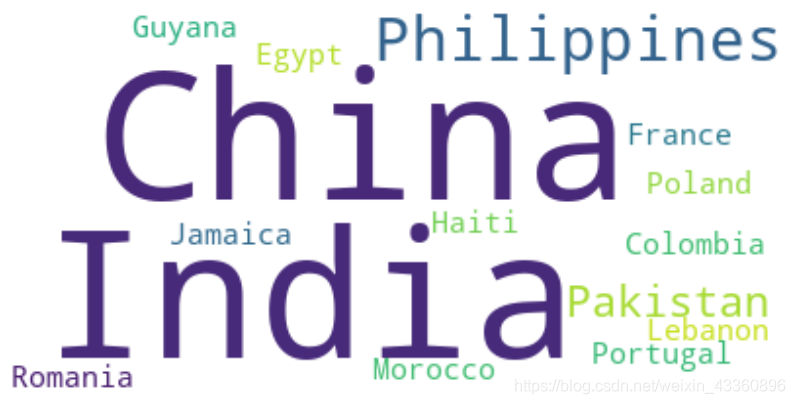
According to the above word cloud, it looks like the majority of the people who immigrated came from one of 15 countries that are displayed by the word cloud. One cool visual that you could build, is perhaps using the map of Canada and a mask and superimposing the word cloud on top of the map of Canada. That would be an interesting visual to build!