需要注意的是 由于散点图的值是随机产生的,因此每个绘图时产生的值都不相同。
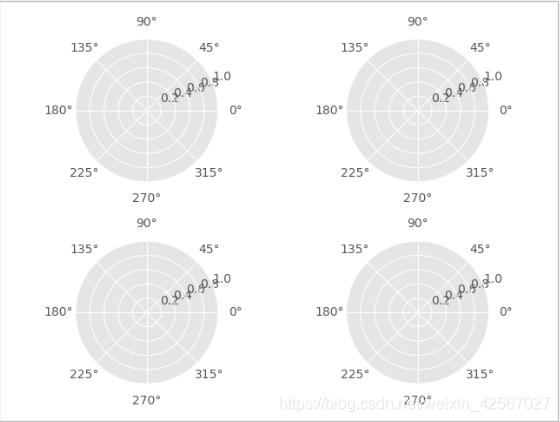
绘制空白的四张子图
// An highlighted block
import numpy as np
import matplotlib.pyplot as plt
from matplotlib.font_manager import FontProperties

plt.style.use('ggplot')#绘图风格
font=FontProperties(fname=r'c:\windows\fonts\simsun.ttc',size=12) #字体与电脑匹配后正确识别

#设置6种标签
ability_size=6
ability_label=[u'进攻',u'防守',u'盘带',u'速度',u'体力',u'射术']

#绘制四张子图
ax1=plt.subplot(221,projection='polar')
ax2=plt.subplot(222,projection='polar')
ax3=plt.subplot(223,projection='polar')
ax4=plt.subplot(224,projection='polar')

plt.show()
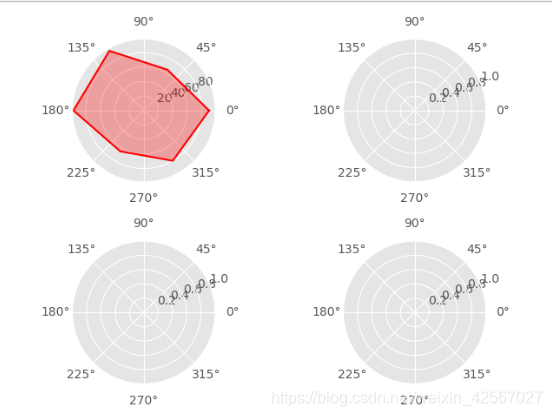
绘制六边形并填充颜色
// An highlighted block
#四个球员的数值变量  标签,最小值和最大值的范围
player={


    'M':np.random.randint(size=ability_size,low=60,high=100),
    'H':np.random.randint(size=ability_size,low=60,high=100),
    'P':np.random.randint(size=ability_size,low=60,high=100),
    'Q':np.random.randint(size=ability_size,low=60,high=100)}

#极坐标角度划分为六份
theta=np.linspace(0,2*np.pi,6,endpoint=False)
theta=np.append(theta,theta[0])
#球员特性绘制
player['M']=np.append(player['M'],player['M'][0])
#绘制六边形
ax1.plot(theta,player['M'],'r')
# #图形颜色填充
ax1.fill(theta,player['M'],'r',alpha=0.3)


plt.show()
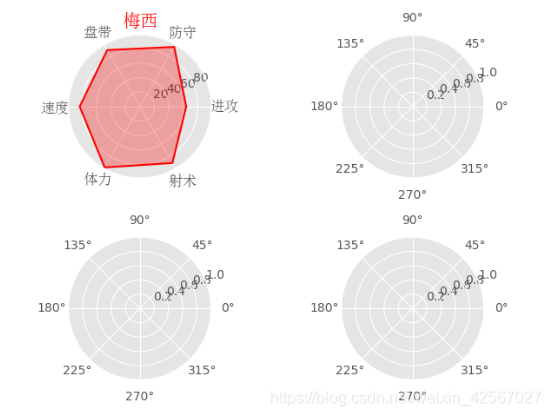
设计六边形的标签和六个角的标签
// An highlighted block
#六边形的角的标签
ax1.set_xticks(theta)
ax1.set_xticklabels(ability_label,y=0.05,fontproperties=font)
#y设置图形的标签
ax1.set_title(u'梅西',fontproperties=font,y=1.01,color='r',size=15)


plt.show()
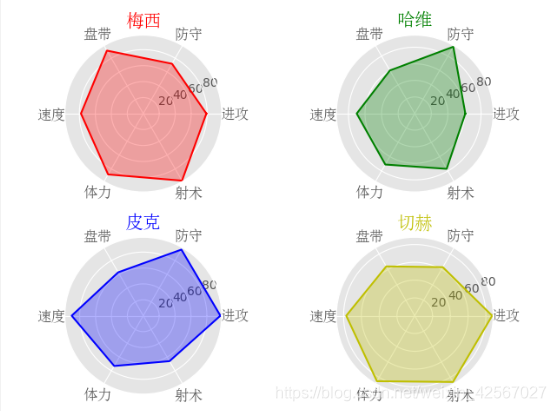
整体绘图
四个图形绘制的算法相似,剩余三个的绘制方式如下:
// An highlighted block
player['H']=np.append(player['H'],player['H'][0])
ax2.plot(theta,player['H'],'g')
ax2.fill(theta,player['H'],'g',alpha=0.3)
ax2.set_xticks(theta)
ax2.set_xticklabels(ability_label,y=0.05,fontproperties=font)
ax2.set_title(u'哈维',fontproperties=font,y=1.01,color='g',size=15)

player['P']=np.append(player['P'],player['P'][0])
ax3.plot(theta,player['P'],'b')
ax3.fill(theta,player['P'],'b',alpha=0.3)
ax3.set_xticks(theta)
ax3.set_xticklabels(ability_label,y=0.05,fontproperties=font)
ax3.set_title(u'皮克',fontproperties=font,y=1.01,color='b',size=15)

player['Q']=np.append(player['Q'],player['Q'][0])
ax4.plot(theta,player['Q'],'y')
ax4.fill(theta,player['Q'],'y',alpha=0.3)
ax4.set_xticks(theta)
ax4.set_xticklabels(ability_label,y=0.05,fontproperties=font)
ax4.set_title(u'切赫',fontproperties=font,y=1.01,color='y',size=15)

plt.show()
总程序
// An highlighted block
'''球员能力图'''
import numpy as np
import matplotlib.pyplot as plt
from matplotlib.font_manager import FontProperties

plt.style.use('ggplot')#绘图风格
font=FontProperties(fname=r'c:\windows\fonts\simsun.ttc',size=12) #字体与电脑匹配后正确识别

#设置6种标签
ability_size=6
ability_label=[u'进攻',u'防守',u'盘带',u'速度',u'体力',u'射术']

#绘制四张子图
ax1=plt.subplot(221,projection='polar')
ax2=plt.subplot(222,projection='polar')
ax3=plt.subplot(223,projection='polar')
ax4=plt.subplot(224,projection='polar')

#四个球员的数值变量  标签,最小值和最大值的范围
player={


    'M':np.random.randint(size=ability_size,low=60,high=100),
    'H':np.random.randint(size=ability_size,low=60,high=100),
    'P':np.random.randint(size=ability_size,low=60,high=100),
    'Q':np.random.randint(size=ability_size,low=60,high=100)}

#极坐标角度划分为六份
theta=np.linspace(0,2*np.pi,6,endpoint=False)
theta=np.append(theta,theta[0])

#球员特性绘制
player['M']=np.append(player['M'],player['M'][0])
#绘制六边形
ax1.plot(theta,player['M'],'r')
# #图形颜色填充
ax1.fill(theta,player['M'],'r',alpha=0.3)
#六边形的角的标签
ax1.set_xticks(theta)
ax1.set_xticklabels(ability_label,y=0.05,fontproperties=font)
#y设置图形的标签
ax1.set_title(u'梅西',fontproperties=font,y=1.01,color='r',size=15)

player['H']=np.append(player['H'],player['H'][0])
ax2.plot(theta,player['H'],'g')
ax2.fill(theta,player['H'],'g',alpha=0.3)
ax2.set_xticks(theta)
ax2.set_xticklabels(ability_label,y=0.05,fontproperties=font)
ax2.set_title(u'哈维',fontproperties=font,y=1.01,color='g',size=15)

player['P']=np.append(player['P'],player['P'][0])
ax3.plot(theta,player['P'],'b')
ax3.fill(theta,player['P'],'b',alpha=0.3)
ax3.set_xticks(theta)
ax3.set_xticklabels(ability_label,y=0.05,fontproperties=font)
ax3.set_title(u'皮克',fontproperties=font,y=1.01,color='b',size=15)

player['Q']=np.append(player['Q'],player['Q'][0])
ax4.plot(theta,player['Q'],'y')
ax4.fill(theta,player['Q'],'y',alpha=0.3)
ax4.set_xticks(theta)
ax4.set_xticklabels(ability_label,y=0.05,fontproperties=font)
ax4.set_title(u'切赫',fontproperties=font,y=1.01,color='y',size=15)

plt.show()