import matplotlib
import matplotlib.pyplot as plt
import numpy as np
from numpy import *
def plot_image():
datList=[]
for line in open("d:\\learning\\places.txt").readlines():
lineArr=line.split('\t')
datList.append([float(lineArr[4]),float(lineArr[3])])
datMat=mat(datList)
#------------------------------------------------------------------------------------------------------
fig=plt.figure()
rect=[0.1,0.1,0.8,0.8]
scatterMarkers=['s','o','^','8','p','d','v','h','>','<']
axprops=dict(xticks=[],yticks=[])
ax0=fig.add_axes(rect,label='ax0',**axprops)
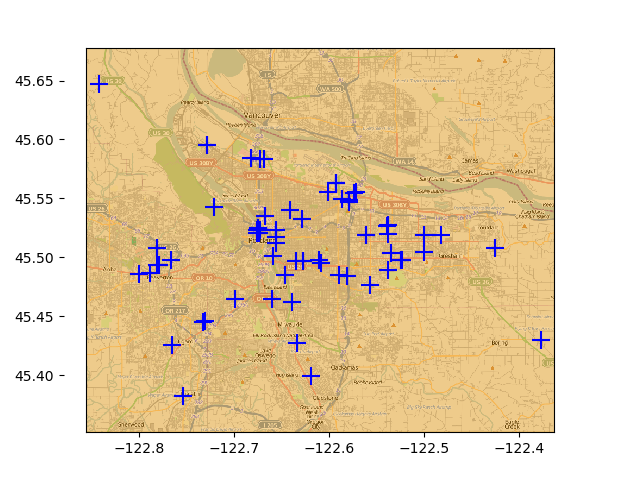
imgP=plt.imread('d:\\learning\\Portland.png')
ax0.imshow(imgP) #背景图片
ax1=fig.add_axes(rect,label='ax1',frameon=False)
markerStyle=scatterMarkers[random.randint(1,6)%len(scatterMarkers)]
ax1.scatter(datMat[:,0].flatten().A[0],datMat[:,1].flatten().A[0],marker='+',s=150,c='b')
plt.show()
plot_image()
最后的效果是: