Prometheus监控学习之路(四)
Prometheus告警配置
告警功能概述
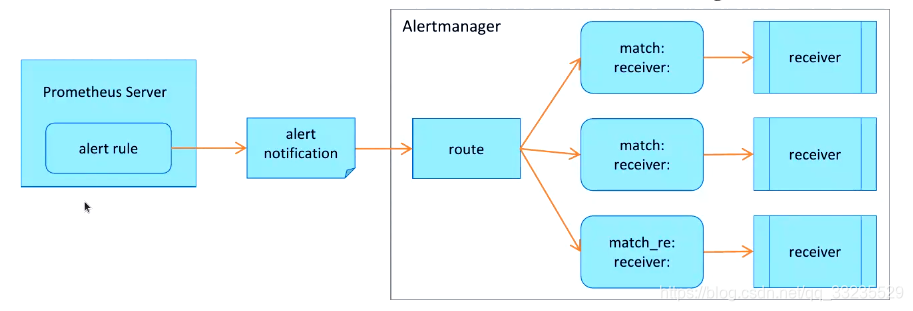
Prometheus对指标的收集、存储同告警能力分属于Prometheus Server和Alertmanager两个独立的组件,前者仅负责于“告警规则”生产告警通知,具体的告警操作则由后者完成。
Alertmanager负责处理有客户端发来的告警通知:
- 客户端通常是Prometheus Server,但他也支持接收来自其它工具的告警
- Alertmanager对告警通知进行分组、去重后根据路由规则将其路由到不同的receiver,如Email、短信或钉钉等
Prometheus监控系统的告警逻辑
首先要配置Prometheus成为Alertmanager的告警客户端,反过来,Alertmanager也是应用程序,他自身同样应该纳入Prometheus的监控目标。
配置逻辑:
在Alertmanager上定义receiver,他们通常是能够基于某个媒介接收告警消息的特定用户
- email、WeChat、slack和webhook等为常见的发送告警信息的媒介
- 在不同的媒介上,代表告警消息消息接收人的地址表示方式也会有所不同
在Alertmanager上定义路由规则,以便将接收到的告警通知按需分别进行处理,在Prometheus上定义告警规则生产告警通知,发送给Alertmanager
Alertmanager
除了基本的告警通知能力外,Alertmanager还支持对告警进行去重、分组、抑制、静默和路由等功能:
- 分组(grouping):将相似告警合并为单个告警通知的机制,在系统因大面积故障而触发告警潮时分组机制能避免用户被大量的告警噪声淹没,进而导致关键信息的隐没
- 抑制(inhibition):系统中某个组件或服务故障而触发告警通知后,那些依赖于该组件或服务的其他组件或服务可能也会因此而触发告警,抑制便是避免类似的级联告警的一种特性,从而让用户能将精力集中于真正的故障所在
- 静默(silent):是指在一个特定的时间窗口内,即便接收到告警通知,Alertmanager也不会真正向用户发送告警信息的行为。通常在系统例行维护期间,需要激活告警系统的静默特性
- 路由(route):用于配置Alertmanager如何处理传入的特定类型的告警通知,其基本逻辑是根据路由匹配规则的匹配结果来确定处理当前告警通知的路径和行为
配置Alertmanager
Altermanager是一个独立的go二进制程序,需要独立部署及维护
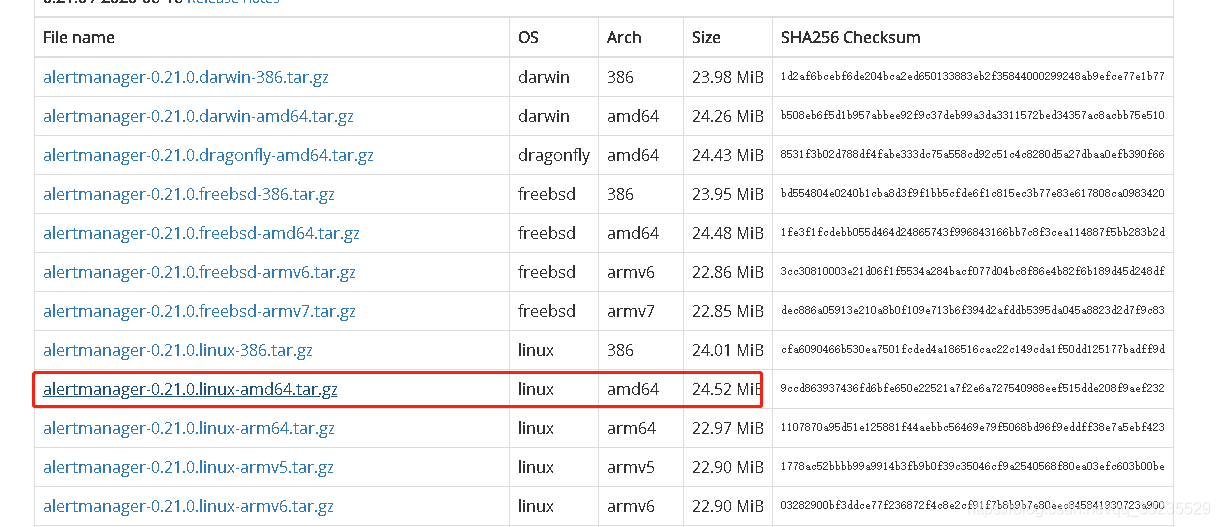
tar xf alertmanager-0.21.0.linux-amd64.tar.gz -C /usr/local/
mv /usr/local/alertmanager-0.21.0.linux-amd64 /usr/local/alertmanager
修改Alertmanager配置文件
vim alertmanager.yml
global:
  resolve_timeout: 5m

route:
  group_by: ['alertname']
  group_wait: 10s
  group_interval: 10s
  repeat_interval: 1h
  receiver: 'email'
receivers:
- name: 'email'
  email_configs:
  - to: '***@163.com'
    from: '***@163.com'
    smarthost: 'smtp.163.com:25'
    auth_username: '***@163.com'
    auth_identity: '***@163.com'
    auth_password: 'OTFXYHONWUFELOTN'
    require_tls: false
这里使用的是163邮箱,其中auth_password需使用的是163邮箱smtp的密码而不是登录邮箱的密码
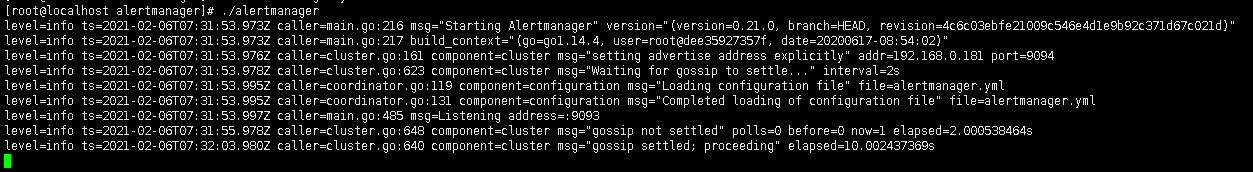
- 启动
修改Prometheus配置文件并配置告警规则
- 这里基于文件发现
global:
  scrape_interval:     15s # Set the scrape interval to every 15 seconds. Default is every 1 minute.
  evaluation_interval: 15s # Evaluate rules every 15 seconds. The default is every 1 minute.
  # scrape_timeout is set to the global default (10s).

# Alertmanager configuration
alerting:
  alertmanagers:
  - file_sd_configs:
    - files:
      - "target/alertmanagers*.yaml"

# Load rules once and periodically evaluate them according to the global 'evaluation_interval'.
rule_files:
  - "rules/*.yaml"
  - "alert_rules/*.yaml"

# A scrape configuration containing exactly one endpoint to scrape:
# Here it's Prometheus itself.
scrape_configs:
  # The job name is added as a label `job=<job_name>` to any timeseries scraped from this config.
  - job_name: 'prometheus'
    # metrics_path defaults to '/metrics'
    # scheme defaults to 'http'.
    static_configs:
    file_sd_configs:
    - files:
      - target/prometheus-*.yaml
      refresh_interval: 2m

  # All nodes
  - job_name: 'nodes'
    file_sd_configs:
    - files:
      - target/nodes-*.yaml
      refresh_interval: 2m

  - job_name: 'alertmanagers'
    file_sd_configs:
    - files:
      - target/alertmanagers*.yaml
      refresh_interval: 2m
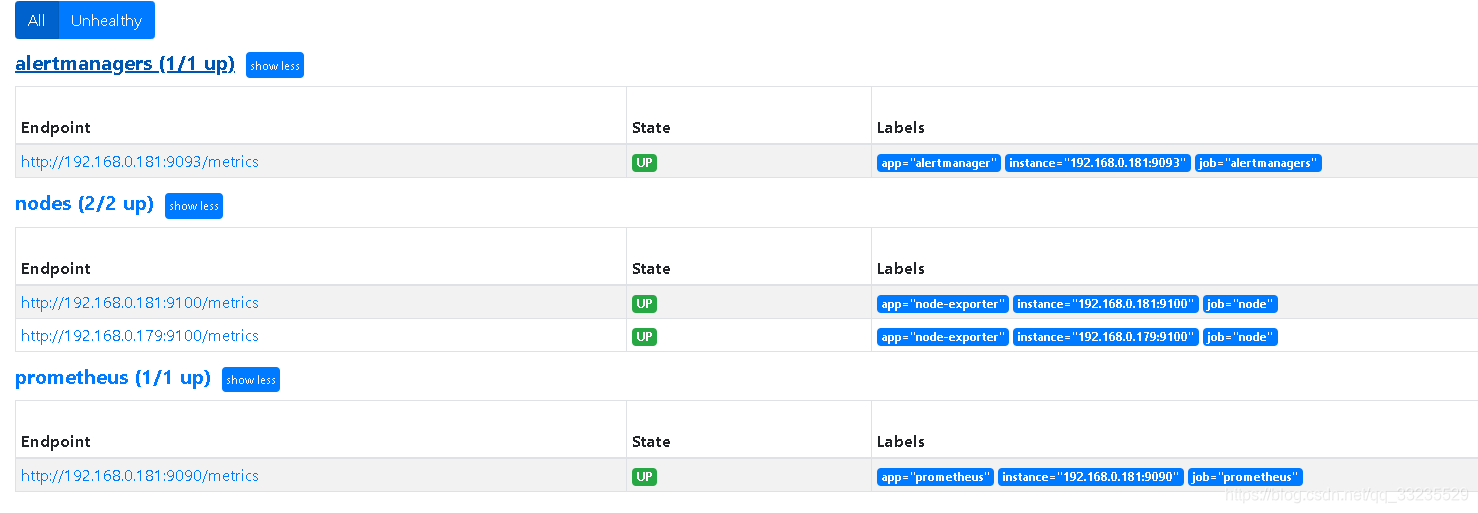
- 编写节点文件
vim /usr/local/prometheus/target/nodes.yaml
- targets:
  - 192.168.0.181:9100
  - 192.168.0.179:9100
  labels:
    app: node-exporter
    job: node
vim /usr/local/prometheus/target/prometheus-servers.yaml
- targets:
  - 192.168.0.181:9090
  labels:
    app: prometheus
    job:  prometheus
vim /usr/local/prometheus/target/alertmanagers.yaml
- targets:
  - 192.168.0.181:9093
  labels:
    app: alertmanager
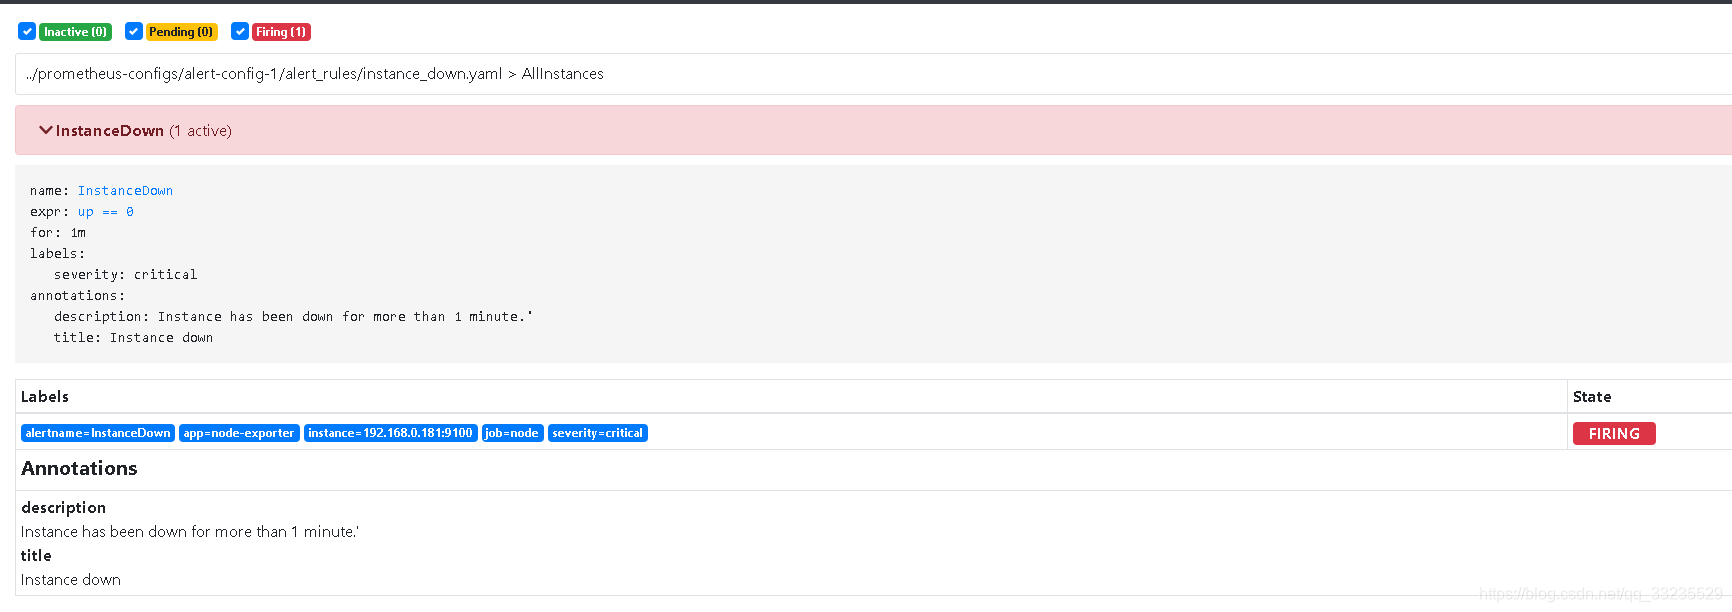
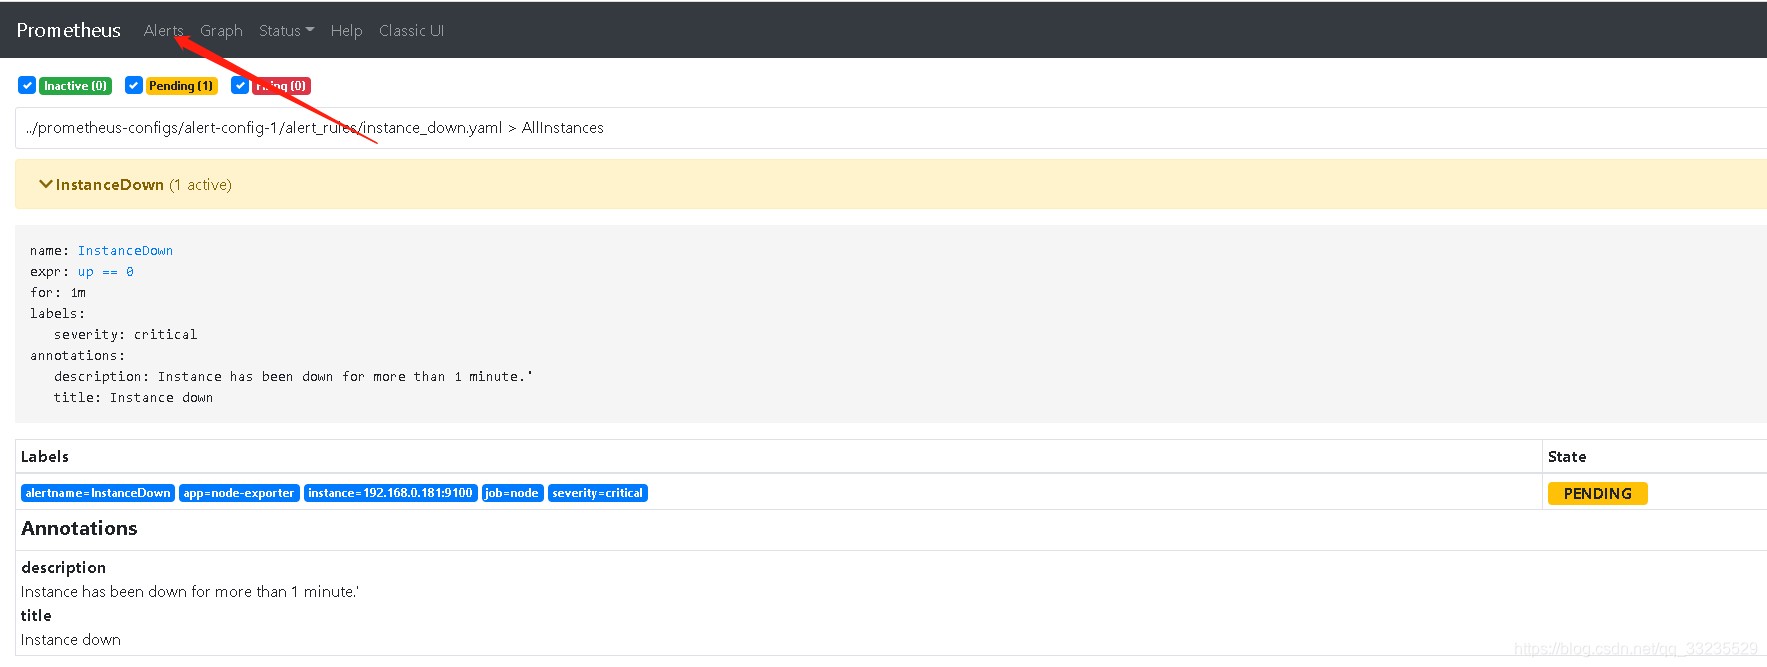
- 配置告警规则
vim /usr/local/prometheus/alert_rules/instance_down.yaml
groups:
- name: AllInstances
  rules:
  - alert: InstanceDown
    # Condition for alerting
    expr: up == 0
    for: 1m
    # Annotation - additional informational labels to store more information
    annotations:
      title: 'Instance down'
      description: Instance has been down for more than 1 minute.'
    # Labels - additional labels to be attached to the alert
    labels:
      severity: 'critical'
这里重点是expr对应的是Prometheus上的指标名称和其对应的值,当其满足条件时触发报警
- 启动Prometheus
- 停掉一个节点的node_exporter
等待一分钟左右查看邮箱