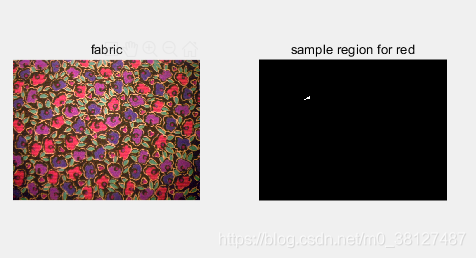
fabric = imread(‘fabric.png’);%读取图像
figure; subplot(121); imshow(fabric), %显示
title(‘fabric’);
load regioncoordinates;%下载颜色区域坐标到工作空间
nColors = 6;
sample_regions = false([size(fabric,1) size(fabric,2) nColors]);
for count = 1:nColors
sample_regions(:,:,count) = roipoly(fabric,…
region_coordinates(:,1,count), …
region_coordinates(:,2,count));%选择每一小块颜色的样本区域
end
subplot(122),
imshow(sample_regions(:,:,2));%显示红色区域的样本
title(‘sample region for red’);
cform = makecform(‘srgb2lab’);%rgb空间转换成Lab空间结构
lab_fabric = applycform(fabric,cform);%rgb空间转换成Lab空间
a = lab_fabric(:,:,2); b = lab_fabric(:,:,3);
color_markers = repmat(0, [nColors, 2]);%初始化颜色均值
for count = 1:nColors
color_markers(count,1)= mean2(a(sample_regions(:,:,count)));%a均值
color_markers(count,2)= mean2(b(sample_regions(:,:,count)));%b均值
end
disp(sprintf(’[%0.3f,%0.3f]’,color_markers(2,1),…
color_markers(2,2)));%显示红色分量样本的均值
color_labels = 0:nColors-1;
a = double(a); b = double(b);
distance = repmat(0,[size(a), nColors]);%初始化距离矩阵
for count = 1:nColors
distance(:,:,count) = ( (a - color_markers(count,1)).^2 + …
(b - color_markers(count,2)).^2 ).^0.5;%计算到各种颜色的距离
end
[value, label] = min(distance,[],3);%求出最小距离的颜色
label = color_labels(label);
clear value distance;
rgb_label = repmat(label,[1 1 3]);
segmented_images = repmat(uint8(0),[size(fabric), nColors]);
for count = 1:nColors
color = fabric;
color(rgb_label ~= color_labels(count)) = 0;%不是标号颜色的像素置0
segmented_images(:,:,:,count) = color;
end
figure;
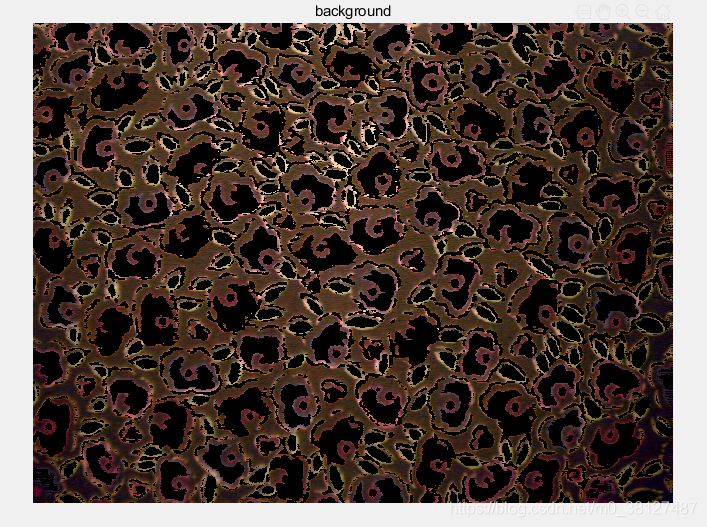
imshow(segmented_images(:,:,:,1)),%显示背景
title(‘background’); figure;
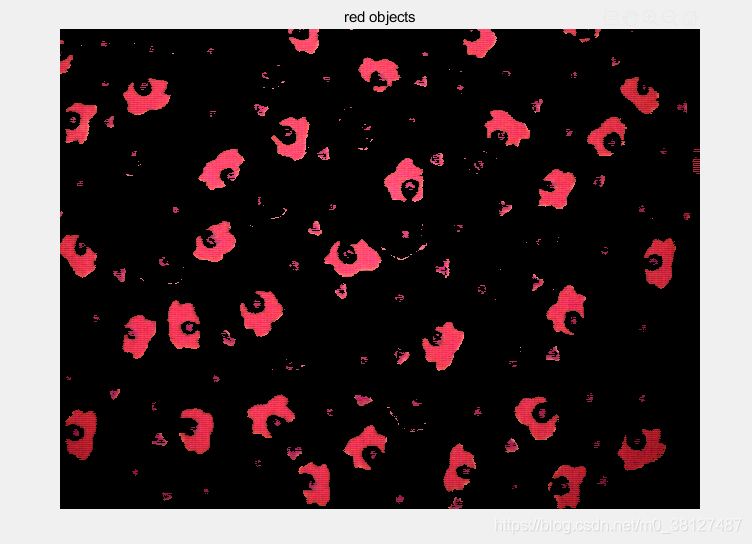
imshow(segmented_images(:,:,:,2)), %显示红色目标
title(‘red objects’); figure;
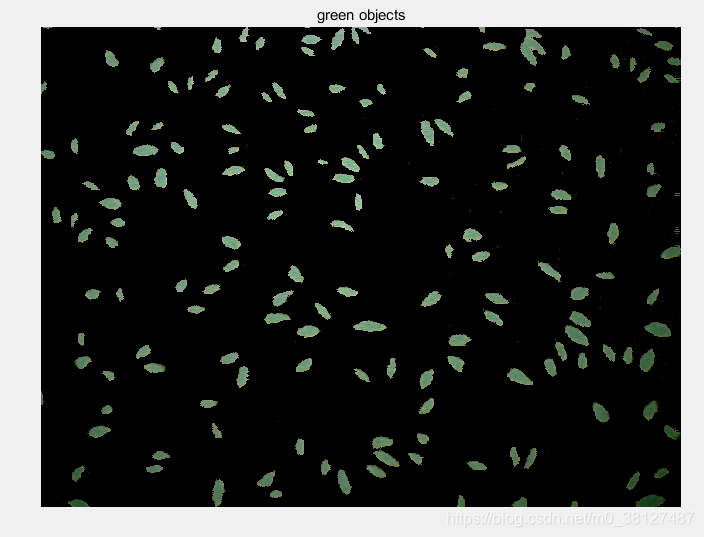
imshow(segmented_images(:,:,:,3)), %显示绿色目标
title(‘green objects’); figure,
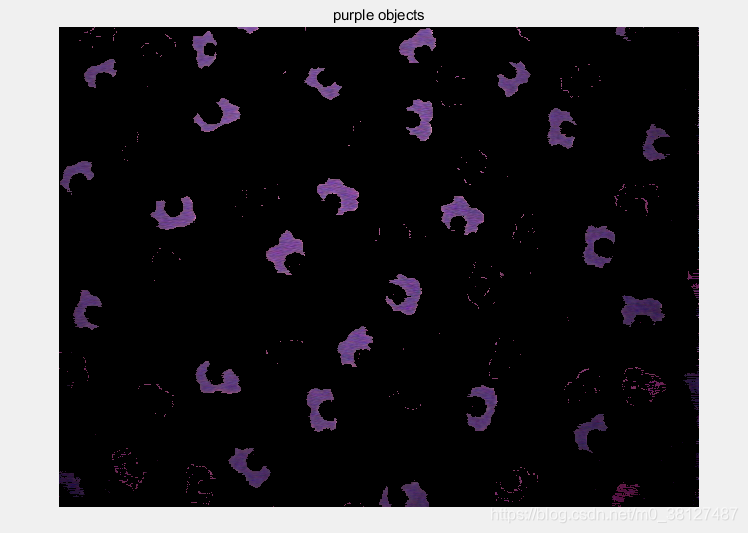
imshow(segmented_images(:,:,:,4)), %显示紫色目标
title(‘purple objects’); figure,
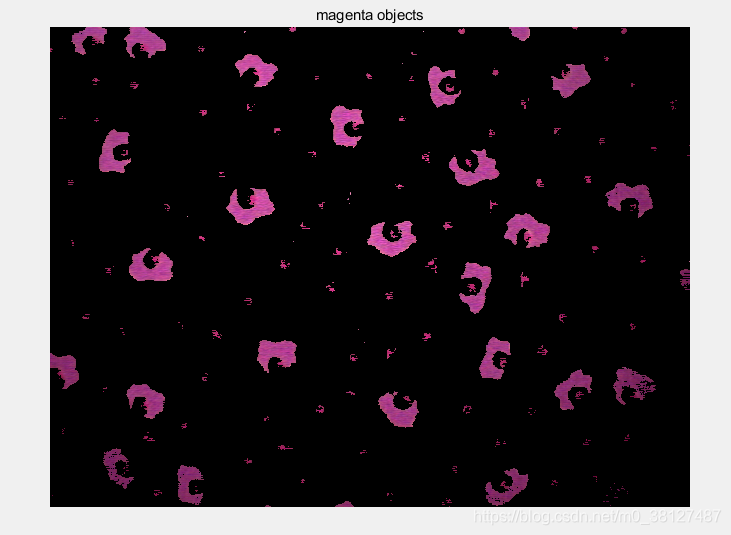
imshow(segmented_images(:,:,:,5)), %显示红紫色目标
title(‘magenta objects’); figure,
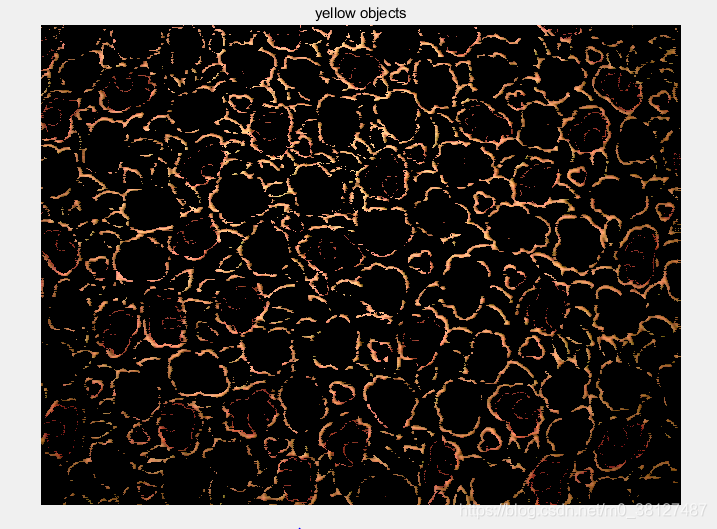
imshow(segmented_images(:,:,:,6)), %显示黄色目标
title(‘yellow objects’);
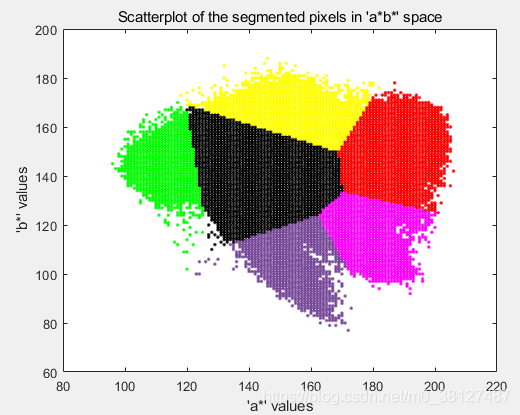
purple = [119/255 73/255 152/255];
plot_labels = {‘k’, ‘r’, ‘g’, purple, ‘m’, ‘y’};
figure
for count = 1:nColors
plot(a(labelcount-1),b(labelcount-1),’.’,‘MarkerEdgeColor’, … plot_labels{count}, ‘MarkerFaceColor’, …
plot_labels{count});%显示各种颜色的散点图
hold on;
end
title(‘Scatterplot of the segmented pixels in ‘‘ab’’ space’);
xlabel(’’‘a*’’ values’); ylabel(’’‘b*’’ values’);
MATLAB图像处理之分割处理
猜你喜欢
转载自blog.csdn.net/m0_38127487/article/details/115259615
今日推荐
周排行