一. 使用mayavi原因
由于torch和open3d冲突,使用torch的时候open3d就使用不了,但是我还是想看一下可视化的点云数据,于是就用mayavi进行可视化。如果有知道怎么解决open3d和torch冲突的朋友,也请留言~
二. 读取bin文件显示
1. 代码
import numpy as np
import mayavi.mlab

#mayavi显示点云
def read_pointcloud_from_bin_file(bin_path):
    pointcloud = np.fromfile(bin_path, dtype=np.float32).reshape(-1,4)
    print(pointcloud.shape)
    print(type(pointcloud))
    x = pointcloud[:, 0]  # x position of point
    xmin = np.amin(x, axis=0)
    xmax = np.amax(x, axis=0)
    y = pointcloud[:, 1]  # y position of point
    ymin = np.amin(y, axis=0)
    ymax = np.amax(y, axis=0)
    z = pointcloud[:, 2]  # z position of point
    zmin = np.amin(z, axis=0)
    zmax = np.amax(z, axis=0)
    print(xmin,xmax,ymin,ymax,zmin,zmax)
    d = np.sqrt(x ** 2 + y ** 2)  # Map Distance from sensor
    vals = 'height'
    if vals == "height":
        col = z
    else:
        col = d
    fig = mayavi.mlab.figure(bgcolor=(0, 0, 0), size=(640, 500))
    mayavi.mlab.points3d(x, y, z,
                         col,  # Values used for Color
                         mode="point",
                         # 灰度图的伪彩映射
                         colormap='spectral',  # 'bone', 'copper', 'gnuplot'
                         # color=(0, 1, 0),   # Used a fixed (r,g,b) instead
                         figure=fig,
                         )
    # 绘制原点
    mayavi.mlab.points3d(0, 0, 0, color=(1, 1, 1), mode="sphere",scale_factor=1)
    # 绘制坐标
    axes = np.array(
        [[20.0, 0.0, 0.0, 0.0], [0.0, 20.0, 0.0, 0.0], [0.0, 0.0, 20.0, 0.0]],
        dtype=np.float64,
    )
    #x轴
    mayavi.mlab.plot3d(
        [0, axes[0, 0]],
        [0, axes[0, 1]],
        [0, axes[0, 2]],
        color=(1, 0, 0),
        tube_radius=None,
        figure=fig,
    )
    #y轴
    mayavi.mlab.plot3d(
        [0, axes[1, 0]],
        [0, axes[1, 1]],
        [0, axes[1, 2]],
        color=(0, 1, 0),
        tube_radius=None,
        figure=fig,
    )
    #z轴
    mayavi.mlab.plot3d(
        [0, axes[2, 0]],
        [0, axes[2, 1]],
        [0, axes[2, 2]],
        color=(0, 0, 1),
        tube_radius=None,
        figure=fig,
    )
    mayavi.mlab.show()


def plot3Dbox(corners):
    for i in range(corners.shape[0]):
        corner = corners[i]
        idx = np.array([0, 1, 2, 3, 0, 4, 5, 6, 7, 4, 5, 1, 2, 6, 7, 3])
        x = corner[0, idx]
        y = corner[1, idx]
        z = corner[2, idx]
        mayavi.mlab.plot3d(x, y, z, color=(0.23, 0.6, 1), colormap='Spectral', representation='wireframe', line_width=5)
        # mlab.show(stop=True)

def main():
    corners = np.array([[[0.0, 1, 1, 0, 0, 1, 1, 0], [0, 0, 1, 1, 0, 0, 1, 1], [0, 0, 0, 0, 1, 1, 1, 1]]])
    plot3Dbox(corners)
    read_pointcloud_from_bin_file("/home/seivl/data/KITTI/training/velodyne/004965.bin")

if __name__ == '__main__':
    main()
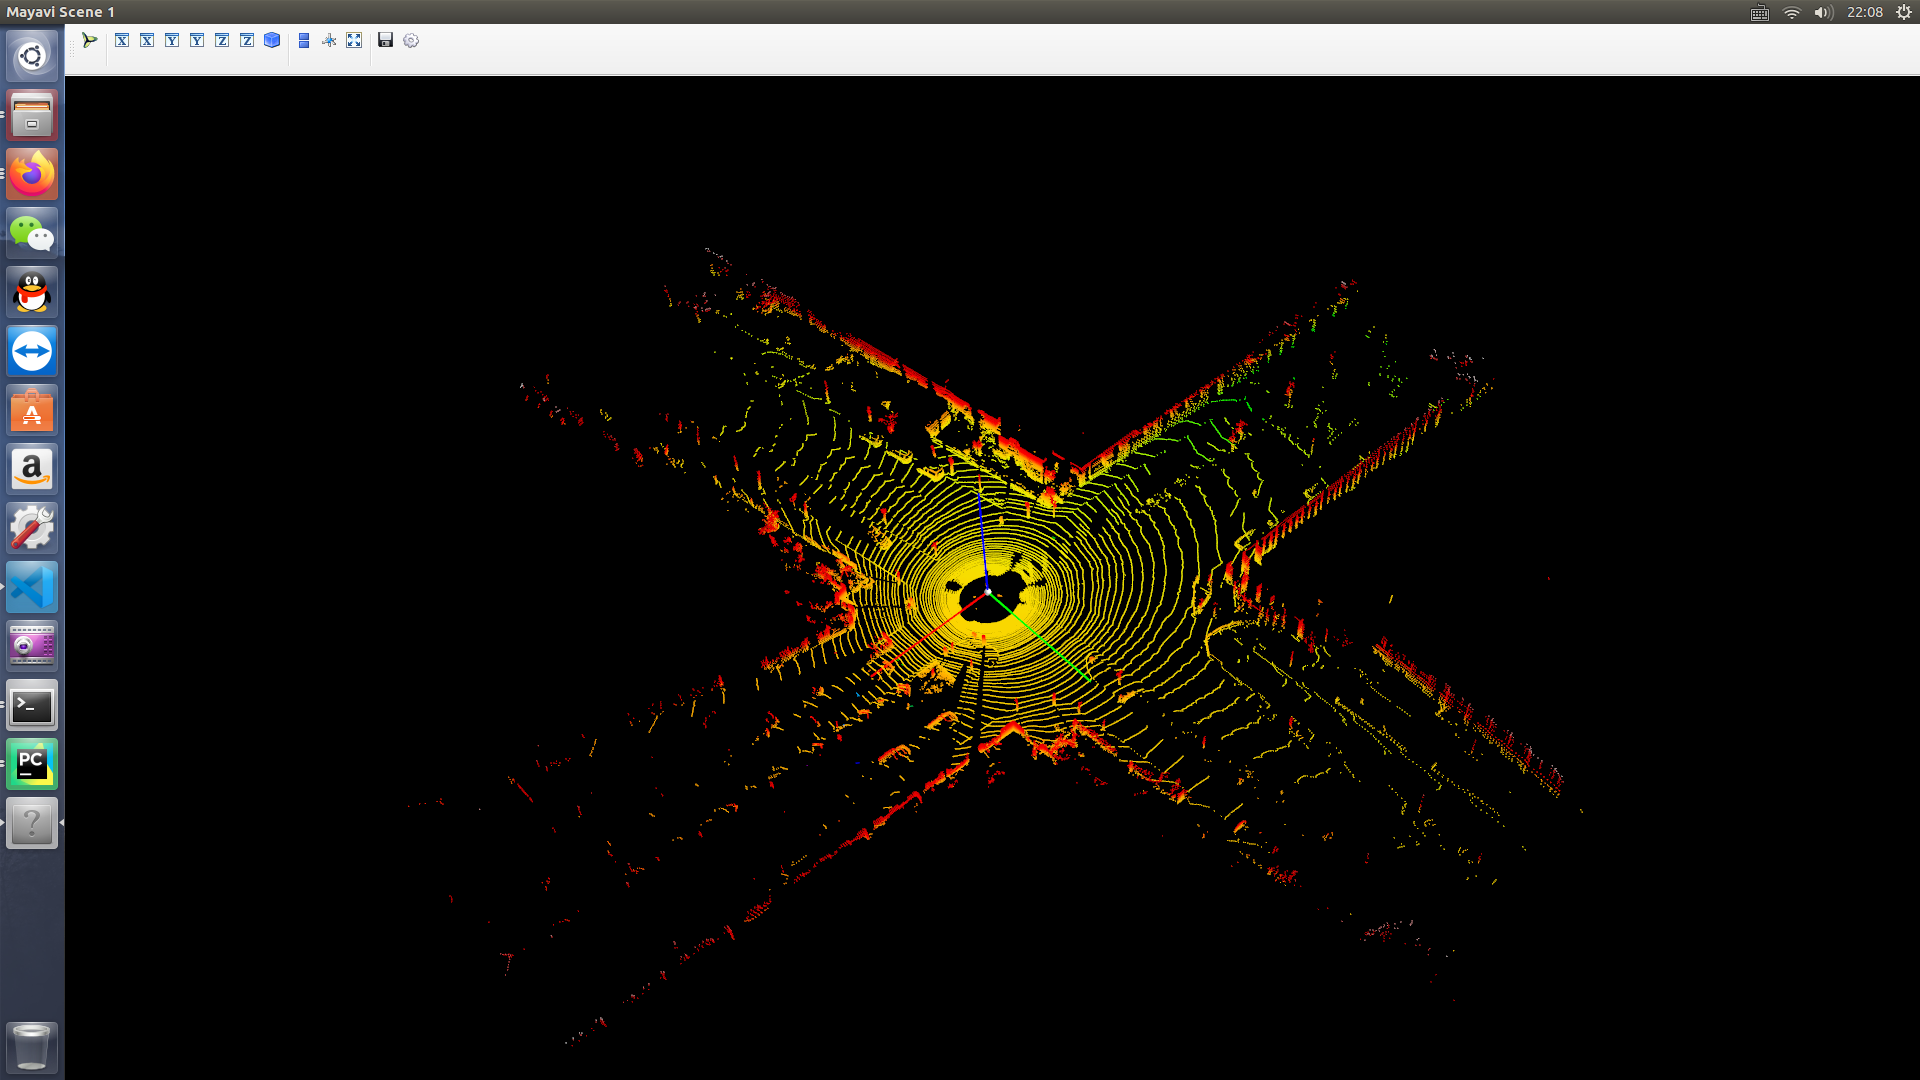
2. 结果
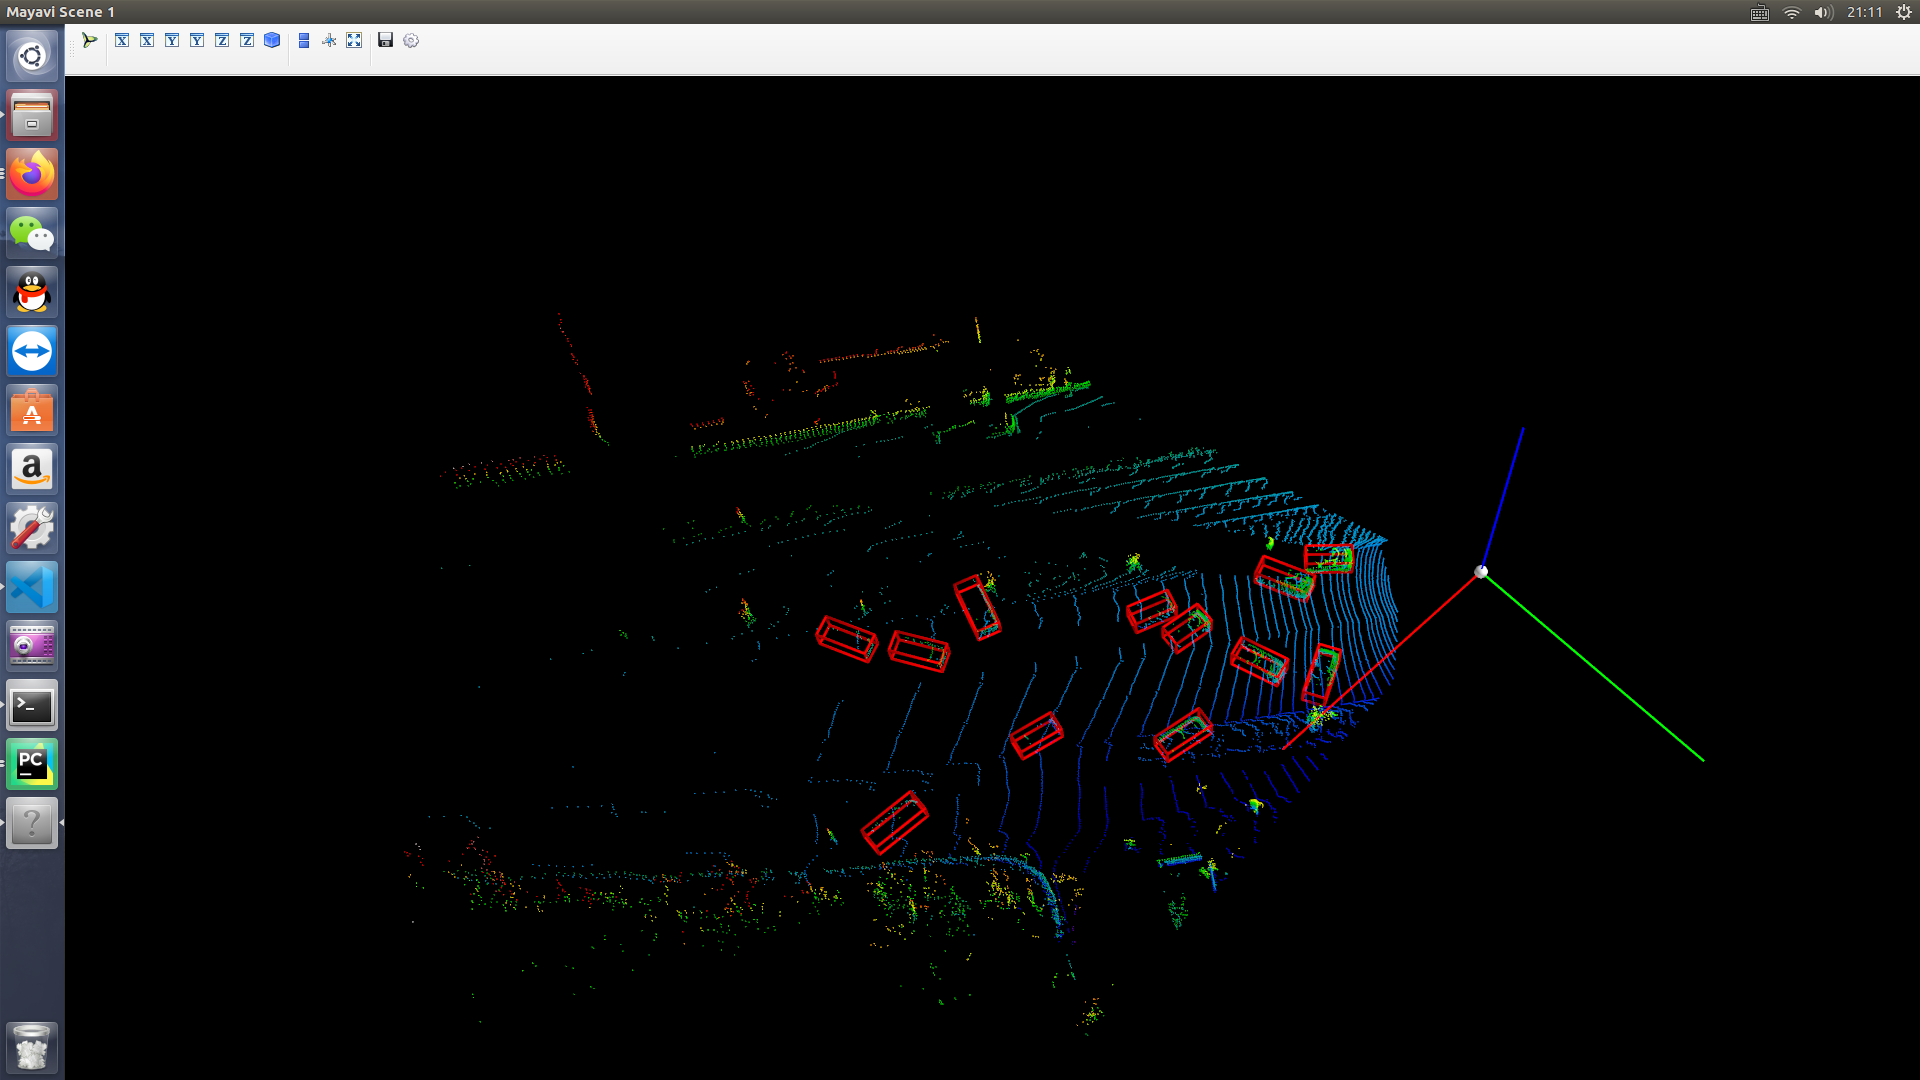
三. SA-SSD中点云和gt_bboxs显示
1. 准备工作
在 kitti.py 这个模块的 def prepare_train_img() 函数最后,加入下面一段代码:
if True:
       test_data = {

    }
       test_data['points'] = points
       test_data['gt_bboxes'] = gt_bboxes
       test_data['gt_types'] = gt_types

       import pickle
       with open("/home/seivl/test_data.pkl", 'wb') as fo:
           pickle.dump(test_data, fo)
2. 代码
import numpy as np
import mayavi.mlab
import pickle

def corners_nd(dims, origin=0.5):
    """generate relative box corners based on length per dim and
    origin point.

    Args:
        dims (float array, shape=[N, ndim]): array of length per dim
        origin (list or array or float): origin point relate to smallest point.

    Returns:
        float array, shape=[N, 2 ** ndim, ndim]: returned corners.
        point layout example: (2d) x0y0, x0y1, x1y0, x1y1;
            (3d) x0y0z0, x0y0z1, x0y1z0, x0y1z1, x1y0z0, x1y0z1, x1y1z0, x1y1z1
            where x0 < x1, y0 < y1, z0 < z1
    """
    ndim = int(dims.shape[1])
    corners_norm = np.stack(
        np.unravel_index(np.arange(2 ** ndim), [2] * ndim), axis=1).astype(
        dims.dtype)
    # now corners_norm has format: (2d) x0y0, x0y1, x1y0, x1y1
    # (3d) x0y0z0, x0y0z1, x0y1z0, x0y1z1, x1y0z0, x1y0z1, x1y1z0, x1y1z1
    # so need to convert to a format which is convenient to do other computing.
    # for 2d boxes, format is clockwise start with minimum point
    # for 3d boxes, please draw lines by your hand.
    if ndim == 2:
        # generate clockwise box corners
        corners_norm = corners_norm[[0, 1, 3, 2]]
    elif ndim == 3:
        corners_norm = corners_norm[[0, 1, 3, 2, 4, 5, 7, 6]]
    corners_norm = corners_norm - np.array(origin, dtype=dims.dtype)
    corners = dims.reshape([-1, 1, ndim]) * corners_norm.reshape(
        [1, 2 ** ndim, ndim])
    return corners

def rotation_3d_in_axis(points, angles, axis=0):
    # points: [N, point_size, 3]
    rot_sin = np.sin(angles)
    rot_cos = np.cos(angles)
    ones = np.ones_like(rot_cos)
    zeros = np.zeros_like(rot_cos)
    if axis == 1:
        rot_mat_T = np.stack([[rot_cos, zeros, -rot_sin], [zeros, ones, zeros],
                              [rot_sin, zeros, rot_cos]])
    elif axis == 2 or axis == -1:
        rot_mat_T = np.stack([[rot_cos, -rot_sin, zeros],
                              [rot_sin, rot_cos, zeros], [zeros, zeros, ones]])
    elif axis == 0:
        rot_mat_T = np.stack([[zeros, rot_cos, -rot_sin],
                              [zeros, rot_sin, rot_cos], [ones, zeros, zeros]])
    else:
        raise ValueError("axis should in range")

    return np.einsum('aij,jka->aik', points, rot_mat_T)

def center_to_corner_box3d(centers, origin=[0.5, 0.5, 0], axis=2):
    """convert kitti locations, dimensions and angles to corners

    Args:
        centers (float array, shape=[N, 3]): locations in kitti label file.
        dims (float array, shape=[N, 3]): dimensions in kitti label file.
        angles (float array, shape=[N]): rotation_y in kitti label file.
        origin (list or array or float): origin point relate to smallest point.
            use [0.5, 1.0, 0.5] in camera and [0.5, 0.5, 0] in lidar.
        axis (int): rotation axis. 1 for camera and 2 for lidar.
    Returns:
        [type]: [description]
    """
    # 'length' in kitti format is in x axis.
    # yzx(hwl)(kitti label file)<->xyz(lhw)(camera)<->z(-x)(-y)(wlh)(lidar)
    # center in kitti format is [0.5, 1.0, 0.5] in xyz.
    corners = corners_nd(centers[:,3:6], origin=origin)
    corners = rotation_3d_in_axis(corners, centers[:,-1], axis=axis)
    corners += centers[:,:3].reshape([-1, 1, 3])
    return corners

def plot3Dbox(corners):
    for i in range(corners.shape[0]):
        corner = corners[i]
        idx = np.array([0, 1, 2, 3, 0, 4, 5, 6, 7, 4, 5, 1, 2, 6, 7, 3])
        x = corner[0, idx]
        y = corner[1, idx]
        z = corner[2, idx]
        # mayavi.mlab.plot3d(x, y, z, color=(0.23, 0.6, 1), colormap='Spectral', representation='wireframe', line_width=5)
        mayavi.mlab.plot3d(x, y, z, color=(1, 0, 0), colormap='Spectral', representation='wireframe')
    mayavi.mlab.show()

def show_points(gt_data):

    pointcloud = gt_data['points']
    print(pointcloud.shape)
    print(type(pointcloud))
    x = pointcloud[:, 0]  # x position of point
    xmin = np.amin(x, axis=0)
    xmax = np.amax(x, axis=0)
    y = pointcloud[:, 1]  # y position of point
    ymin = np.amin(y, axis=0)
    ymax = np.amax(y, axis=0)
    z = pointcloud[:, 2]  # z position of point
    zmin = np.amin(z, axis=0)
    zmax = np.amax(z, axis=0)
    print(xmin,xmax,ymin,ymax,zmin,zmax)
    d = np.sqrt(x ** 2 + y ** 2)  # Map Distance from sensor
    vals = 'height'
    if vals == "height":
        col = z
    else:
        col = d
    fig = mayavi.mlab.figure(bgcolor=(0, 0, 0), size=(640, 500))
    mayavi.mlab.points3d(x, y, z,
                         col,  # Values used for Color
                         mode="point",
                         # 灰度图的伪彩映射
                         colormap='spectral',  # 'bone', 'copper', 'gnuplot'
                         # color=(0, 1, 0),   # Used a fixed (r,g,b) instead
                         figure=fig,
                         )
    # 绘制原点
    mayavi.mlab.points3d(0, 0, 0, color=(1, 1, 1), mode="sphere",scale_factor=1)
    # 绘制坐标
    axes = np.array(
        [[20.0, 0.0, 0.0, 0.0], [0.0, 20.0, 0.0, 0.0], [0.0, 0.0, 20.0, 0.0]],
        dtype=np.float64,
    )
    #x轴
    mayavi.mlab.plot3d(
        [0, axes[0, 0]],
        [0, axes[0, 1]],
        [0, axes[0, 2]],
        color=(1, 0, 0),
        tube_radius=None,
        figure=fig,
    )
    #y轴
    mayavi.mlab.plot3d(
        [0, axes[1, 0]],
        [0, axes[1, 1]],
        [0, axes[1, 2]],
        color=(0, 1, 0),
        tube_radius=None,
        figure=fig,
    )
    #z轴
    mayavi.mlab.plot3d(
        [0, axes[2, 0]],
        [0, axes[2, 1]],
        [0, axes[2, 2]],
        color=(0, 0, 1),
        tube_radius=None,
        figure=fig,
    )

    corners = center_to_corner_box3d(gt_data['gt_bboxes'])
    corners = np.array(corners).transpose(0, 2, 1)
    plot3Dbox(np.array(corners))

    mayavi.mlab.show()

def main():
    with open("/home/seivl/test_data.pkl", 'rb') as fo:
        gt_data = pickle.load(fo)

    show_points(gt_data)

if __name__ == '__main__':
    main()
2. 结果