文章目录
一、系统选型
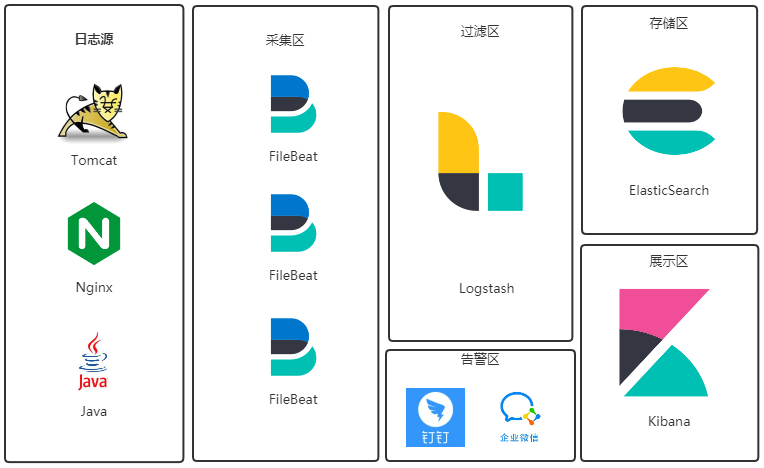
Elastic 公司有一套免费开源的日志采集系统(ELK),所以我选择拿来即用。
日志流:
日志文件→FileBeat→Logstash→ElasticSearch→Kibana
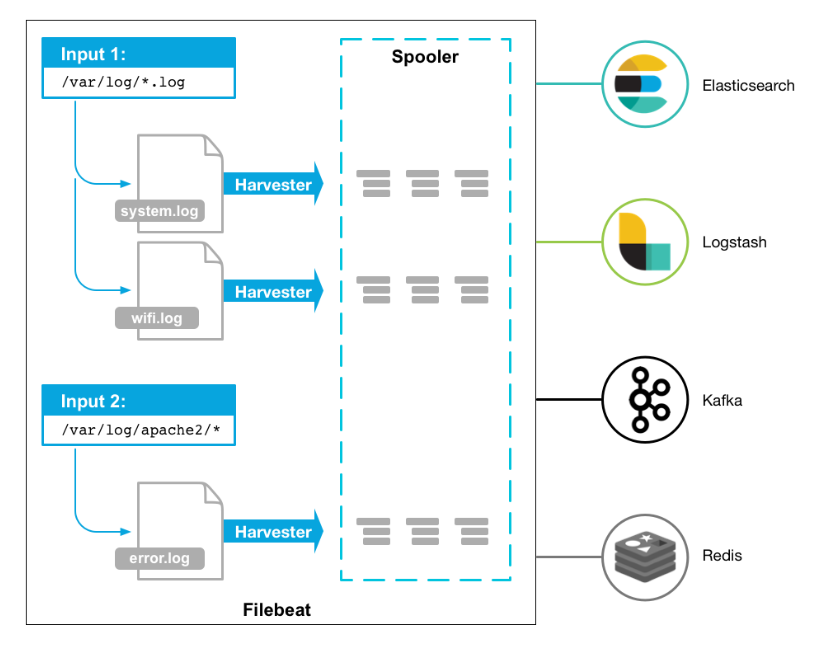
1.1 Filebeat
Filebeat是一款轻量级日志采集器,可用于转发和汇总日志与文件。Filebeat内置有多种模块(Nginx、MySQL、Redis、Elasticsearch、Logstash等),可针对常见格式的日志大大简化收集、解析和可视化过程,只需一条命令即可。
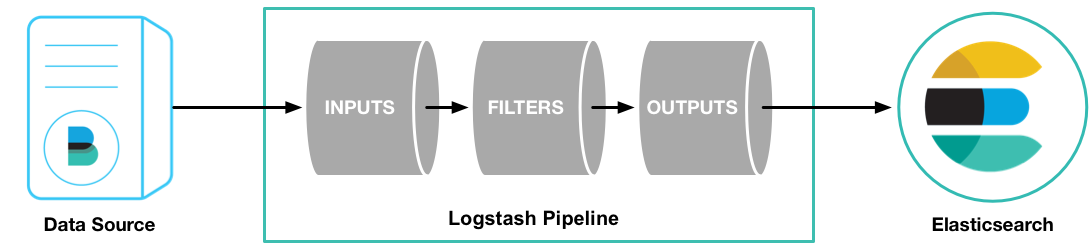
1.2 Logstash
Logstash是一个分布式日志收集框架,开发语言是JRuby,经常与ElasticSearch,Kibana配合使用组成著名的ELK技术栈,所谓ELK就是ElasticSearch、Logstash、Kibana这三个组件。
1.3 ElasticSearch
Elasticsearch 是一个分布式、可扩展、实时的搜索与数据分析引擎。它提供了一个分布式多用户能力的全文搜索引擎,基于RESTful web接口。
1.4 Kibana
Kibana 是一个免费且开放的用户界面,能够让您对 Elasticsearch 数据进行可视化。您可以进行各种操作,从跟踪查询负载,到理解请求如何流经您的整个应用,都能轻松完成。

二、软件版本
各版本下载地址:https://www.elastic.co/cn/downloads/past-releases
| 软件 | 版本 | 下载链接 |
|---|---|---|
| Filebeat | 7.13.0 | https://artifacts.elastic.co/downloads/beats/filebeat/filebeat-7.13.0-linux-x86_64.tar.gz |
| Logstash | 7.13.0 | https://artifacts.elastic.co/downloads/logstash/logstash-7.13.0-linux-x86_64.tar.gz |
| ElasticSearch | 7.13.0 | https://artifacts.elastic.co/downloads/elasticsearch/elasticsearch-7.13.0-linux-x86_64.tar.gz |
| Kibana | 7.13.0 | https://artifacts.elastic.co/downloads/kibana/kibana-7.13.0-linux-x86_64.tar.gz |
三、服务器规划
购买了三台阿里云服务器用来搭建日志系统(生产环境建议加大CPU与内存)
| 内网IP | 公网IP | 系统 | CPU | 内存 | 角色 |
|---|---|---|---|---|---|
| 172.29.117.169 | 39.103.208.50 | CentOS 7.9 64位 | 4 | 8g | Logstash |
| 172.29.117.170 | 121.89.243.103 | CentOS 7.9 64位 | 4 | 8g | ElasticSearch |
| 172.29.117.171 | 39.99.236.120 | CentOS 7.9 64位 | 4 | 8g | Kibana |
四、安装步骤
4.1 ElasticSearch
注:ElasticSearch本文采用单节点安装,生产环境按需增加节点。
- 系统资源配置
- 最大文件数
[root@iZ8vbcmookvg1sornmosmqZ ~]# vim /etc/security/limits.conf
# 末尾追加以下内容
* soft nofile 65536
* hard nofile 65536
* soft nproc 4096
* hard nproc 4096
es soft memlock unlimited
es hard memlock unlimited
- 内核参数
[root@iZ8vbcmookvg1sornmosmqZ ~]# vim /etc/sysctl.conf
# 末尾追加以下内容
vm.max_map_count=655360
# 刷新
[root@iZ8vbcmookvg1sornmosmqZ ~]# sysctl -p
- 使用普通用户安装
[root@iZ8vbcmookvg1sornmosmqZ ~]# useradd es
[root@iZ8vbcmookvg1sornmosmqZ ~]# su - es
# 下载安装包
[es@iZ8vbcmookvg1sornmosmqZ ~]$ wget https://artifacts.elastic.co/downloads/elasticsearch/elasticsearch-7.13.0-linux-x86_64.tar.gz
# 解压
[es@iZ8vbcmookvg1sornmosmqZ ~]$ tar -zxvf elasticsearch-7.13.0-linux-x86_64.tar.gz
# 修改配置
[es@iZ8vbcmookvg1sornmosmqZ ~]$ vim elasticsearch-7.13.0/config/elasticsearch.yml
参考配置
# ======================== Elasticsearch Configuration =========================
#
# NOTE: Elasticsearch comes with reasonable defaults for most settings.
#       Before you set out to tweak and tune the configuration, make sure you
#       understand what are you trying to accomplish and the consequences.
#
# The primary way of configuring a node is via this file. This template lists
# the most important settings you may want to configure for a production cluster.
#
# Please consult the documentation for further information on configuration options:
# https://www.elastic.co/guide/en/elasticsearch/reference/index.html
#
# ---------------------------------- Cluster -----------------------------------
#
# Use a descriptive name for your cluster:
#
cluster.name: my-application
#
# ------------------------------------ Node ------------------------------------
#
# Use a descriptive name for the node:
#
node.name: node-1
#
# Add custom attributes to the node:
#
#node.attr.rack: r1
#
# ----------------------------------- Paths ------------------------------------
#
# Path to directory where to store the data (separate multiple locations by comma):
#
path.data: data
#
# Path to log files:
#
path.logs: logs
#
# ----------------------------------- Memory -----------------------------------
#
# Lock the memory on startup:
#
#bootstrap.memory_lock: true
#
# Make sure that the heap size is set to about half the memory available
# on the system and that the owner of the process is allowed to use this
# limit.
#
# Elasticsearch performs poorly when the system is swapping the memory.
#
# ---------------------------------- Network -----------------------------------
#
# By default Elasticsearch is only accessible on localhost. Set a different
# address here to expose this node on the network:
#
network.host: 0.0.0.0
#
# By default Elasticsearch listens for HTTP traffic on the first free port it
# finds starting at 9200. Set a specific HTTP port here:
#
http.port: 9200
#
# For more information, consult the network module documentation.
#
# --------------------------------- Discovery ----------------------------------
#
# Pass an initial list of hosts to perform discovery when this node is started:
# The default list of hosts is ["127.0.0.1", "[::1]"]
#
discovery.seed_hosts: ["127.0.0.1:9200"]
#
# Bootstrap the cluster using an initial set of master-eligible nodes:
#
cluster.initial_master_nodes: ["node-1"]
#
# For more information, consult the discovery and cluster formation module documentation.
#
# ---------------------------------- Various -----------------------------------
#
# Require explicit names when deleting indices:
#
#action.destructive_requires_name: true

# 跨域配置
http.cors.enabled: true
http.cors.allow-origin: "*"
# 创建数据目录
[es@iZ8vbcmookvg1sornmosmqZ ~]$ mkdir elasticsearch-7.13.0/data
# 启动
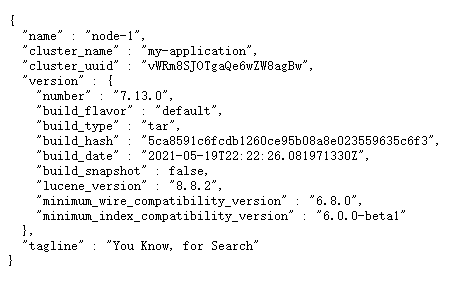
[es@iZ8vbcmookvg1sornmosmqZ ~]$ elasticsearch-7.13.0/bin/elasticsearch
访问 http://121.89.243.103:9200/
4.2 Logstash
# 下载
[root@iZ8vbcmookvg1sornmosmpZ ~]# wget https://artifacts.elastic.co/downloads/logstash/logstash-7.13.0-linux-x86_64.tar.gz
# 解压
[root@iZ8vbcmookvg1sornmosmpZ ~]# tar -zxvf logstash-7.13.0-linux-x86_64.tar.gz
4.3 Filebeat
注:Filebeat主要功能是采集日志,所以一般安装在日志源服务器上。
# 下载
[root@aliyun-prod-spa03-java01 ~]# wget https://artifacts.elastic.co/downloads/beats/filebeat/filebeat-7.13.0-linux-x86_64.tar.gz
# 解压
[root@aliyun-prod-spa03-java01 ~]# tar -zxvf filebeat-7.13.0-linux-x86_64.tar.gz
4.4 Kibana
# 下载
[root@iZ8vbcmookvg1sornmosmoZ ~]# wget https://artifacts.elastic.co/downloads/kibana/kibana-7.13.0-linux-x86_64.tar.gz
# 解压
[root@iZ8vbcmookvg1sornmosmoZ ~]# tar -zxvf kibana-7.13.0-linux-x86_64.tar.gz
# 修改配置
[root@iZ8vbcmookvg1sornmosmoZ ~]# vim kibana-7.13.0-linux-x86_64/config/kibana.yml
参考配置
# Kibana is served by a back end server. This setting specifies the port to use.
server.port: 5601

# Specifies the address to which the Kibana server will bind. IP addresses and host names are both valid values.
# The default is 'localhost', which usually means remote machines will not be able to connect.
# To allow connections from remote users, set this parameter to a non-loopback address.
server.host: "0.0.0.0"

# Enables you to specify a path to mount Kibana at if you are running behind a proxy.
# Use the `server.rewriteBasePath` setting to tell Kibana if it should remove the basePath
# from requests it receives, and to prevent a deprecation warning at startup.
# This setting cannot end in a slash.
#server.basePath: ""

# Specifies whether Kibana should rewrite requests that are prefixed with
# `server.basePath` or require that they are rewritten by your reverse proxy.
# This setting was effectively always `false` before Kibana 6.3 and will
# default to `true` starting in Kibana 7.0.
#server.rewriteBasePath: false

# Specifies the public URL at which Kibana is available for end users. If
# `server.basePath` is configured this URL should end with the same basePath.
#server.publicBaseUrl: ""

# The maximum payload size in bytes for incoming server requests.
#server.maxPayload: 1048576

# The Kibana server's name.  This is used for display purposes.
#server.name: "your-hostname"

# The URLs of the Elasticsearch instances to use for all your queries.
# ES地址,内网互通优先写内网
elasticsearch.hosts: ["http://172.29.117.170:9200"]

# Kibana uses an index in Elasticsearch to store saved searches, visualizations and
# dashboards. Kibana creates a new index if the index doesn't already exist.
#kibana.index: ".kibana"

# The default application to load.
#kibana.defaultAppId: "home"

# If your Elasticsearch is protected with basic authentication, these settings provide
# the username and password that the Kibana server uses to perform maintenance on the Kibana
# index at startup. Your Kibana users still need to authenticate with Elasticsearch, which
# is proxied through the Kibana server.
#elasticsearch.username: "kibana_system"
#elasticsearch.password: "pass"

# Enables SSL and paths to the PEM-format SSL certificate and SSL key files, respectively.
# These settings enable SSL for outgoing requests from the Kibana server to the browser.
#server.ssl.enabled: false
#server.ssl.certificate: /path/to/your/server.crt
#server.ssl.key: /path/to/your/server.key

# Optional settings that provide the paths to the PEM-format SSL certificate and key files.
# These files are used to verify the identity of Kibana to Elasticsearch and are required when
# xpack.security.http.ssl.client_authentication in Elasticsearch is set to required.
#elasticsearch.ssl.certificate: /path/to/your/client.crt
#elasticsearch.ssl.key: /path/to/your/client.key

# Optional setting that enables you to specify a path to the PEM file for the certificate
# authority for your Elasticsearch instance.
#elasticsearch.ssl.certificateAuthorities: [ "/path/to/your/CA.pem" ]

# To disregard the validity of SSL certificates, change this setting's value to 'none'.
#elasticsearch.ssl.verificationMode: full

# Time in milliseconds to wait for Elasticsearch to respond to pings. Defaults to the value of
# the elasticsearch.requestTimeout setting.
#elasticsearch.pingTimeout: 1500

# Time in milliseconds to wait for responses from the back end or Elasticsearch. This value
# must be a positive integer.
#elasticsearch.requestTimeout: 30000

# List of Kibana client-side headers to send to Elasticsearch. To send *no* client-side
# headers, set this value to [] (an empty list).
#elasticsearch.requestHeadersWhitelist: [ authorization ]

# Header names and values that are sent to Elasticsearch. Any custom headers cannot be overwritten
# by client-side headers, regardless of the elasticsearch.requestHeadersWhitelist configuration.
#elasticsearch.customHeaders: {}

# Time in milliseconds for Elasticsearch to wait for responses from shards. Set to 0 to disable.
#elasticsearch.shardTimeout: 30000

# Logs queries sent to Elasticsearch. Requires logging.verbose set to true.
#elasticsearch.logQueries: false

# Specifies the path where Kibana creates the process ID file.
#pid.file: /run/kibana/kibana.pid

# Enables you to specify a file where Kibana stores log output.
#logging.dest: stdout

# Set the value of this setting to true to suppress all logging output.
#logging.silent: false

# Set the value of this setting to true to suppress all logging output other than error messages.
#logging.quiet: false

# Set the value of this setting to true to log all events, including system usage information
# and all requests.
#logging.verbose: false

# Set the interval in milliseconds to sample system and process performance
# metrics. Minimum is 100ms. Defaults to 5000.
#ops.interval: 5000

# Specifies locale to be used for all localizable strings, dates and number formats.
# Supported languages are the following: English - en , by default , Chinese - zh-CN .
i18n.locale: "zh-CN"
# 启动
[root@iZ8vbcmookvg1sornmosmoZ ~]# kibana-7.13.0-linux-x86_64/bin/kibana --allow-root
访问:http://39.99.236.120:5601/

五、接入测试
5.1 Logstash配置
[root@iZ8vbcmookvg1sornmosmpZ ~]# cd logstash-7.13.0/
[root@iZ8vbcmookvg1sornmosmpZ logstash-7.13.0]# cp config/logstash-sample.conf config/logstash-beat.conf
[root@iZ8vbcmookvg1sornmosmpZ logstash-7.13.0]# vim config/logstash-beat.conf
参考配置。这里先不写filter,不同的输入日志对应不同的规则,以后按需编写
# Sample Logstash configuration for creating a simple
# Beats -> Logstash -> Elasticsearch pipeline.

input {


  beats {


    port => 5044
  }
}

output {


  elasticsearch {


    hosts => ["http://172.29.117.170:9200"]
    index => "%{

    [@metadata][beat]}-%{

    [@metadata][version]}-%{

    +YYYY.MM.dd}"
  }
  # 打印日志
  stdout {

     codec => rubydebug }
}
# 启动
[root@iZ8vbcmookvg1sornmosmpZ logstash-7.13.0]# bin/logstash -f config/logstash-beat.conf --config.reload.automatic
--config.reload.automatic 参数设定会自动读取变更的配置文件,而不需要重启logstash
5.2 Filebeat配置
这里以采集 nginx 的输出日志作为范例
# 启动beat的nginx模块
[root@localhost ~]# cd filebeat-7.13.0-linux-x86_64/
[root@localhost filebeat-7.13.0-linux-x86_64]# ./filebeat modules enable nginx
Enabled nginx
# 修改nginx module配置
[root@localhost filebeat-7.13.0-linux-x86_64]# cd modules.d/
[root@localhost modules.d]# vim nginx.yml
参考配置
# Module: nginx
# Docs: https://www.elastic.co/guide/en/beats/filebeat/7.x/filebeat-module-nginx.html

- module: nginx
  # Access logs
  access:
    enabled: true

    # Set custom paths for the log files. If left empty,
    # Filebeat will choose the paths depending on your OS.
    var.paths: ["/var/log/nginx/access.log"]

  # Error logs
  error:
    enabled: true

    # Set custom paths for the log files. If left empty,
    # Filebeat will choose the paths depending on your OS.
    var.paths: ["/var/log/nginx/error.log"]

  # Ingress-nginx controller logs. This is disabled by default. It could be used in Kubernetes environments to parse ingress-nginx logs
  ingress_controller:
    enabled: false

    # Set custom paths for the log files. If left empty,
    # Filebeat will choose the paths depending on your OS.
    #var.paths:
创建输出到logstash的配置文件
# 回到主目录
[root@localhost modules.d]# cd ../
# 创建配置文件
[root@localhost filebeat-7.13.0-linux-x86_64]# vim filebeat_logstash.yml
参考配置
# ============================== Filebeat modules ==============================

filebeat.config.modules:
  # Glob pattern for configuration loading
  path: ${

    path.config}/modules.d/*.yml

  # Set to true to enable config reloading
  reload.enabled: false

  # Period on which files under path should be checked for changes
  #reload.period: 10s

# ------------------------------ Logstash Output -------------------------------
output.logstash:
  # The Logstash hosts
  hosts: ["172.29.117.169:5044"]

  # Optional SSL. By default is off.
  # List of root certificates for HTTPS server verifications
  #ssl.certificate_authorities: ["/etc/pki/root/ca.pem"]

  # Certificate for SSL client authentication
  #ssl.certificate: "/etc/pki/client/cert.pem"

  # Client Certificate Key
  #ssl.key: "/etc/pki/client/cert.key"
# 启动
[root@localhost filebeat-7.13.0-linux-x86_64]# ./filebeat -e -c filebeat_logstash.yml
访问几次nginx,使它产生日志,然后查看es中的数据
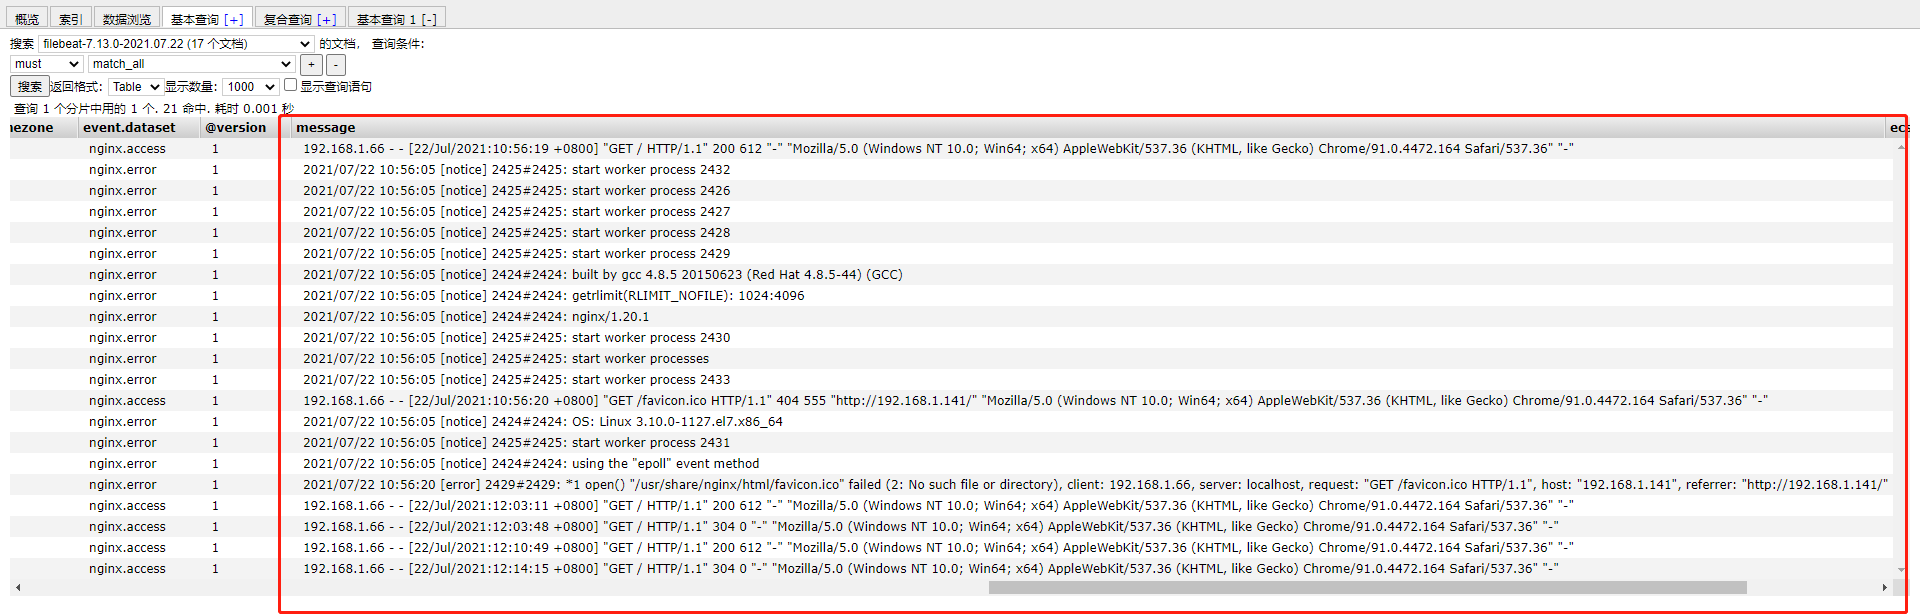
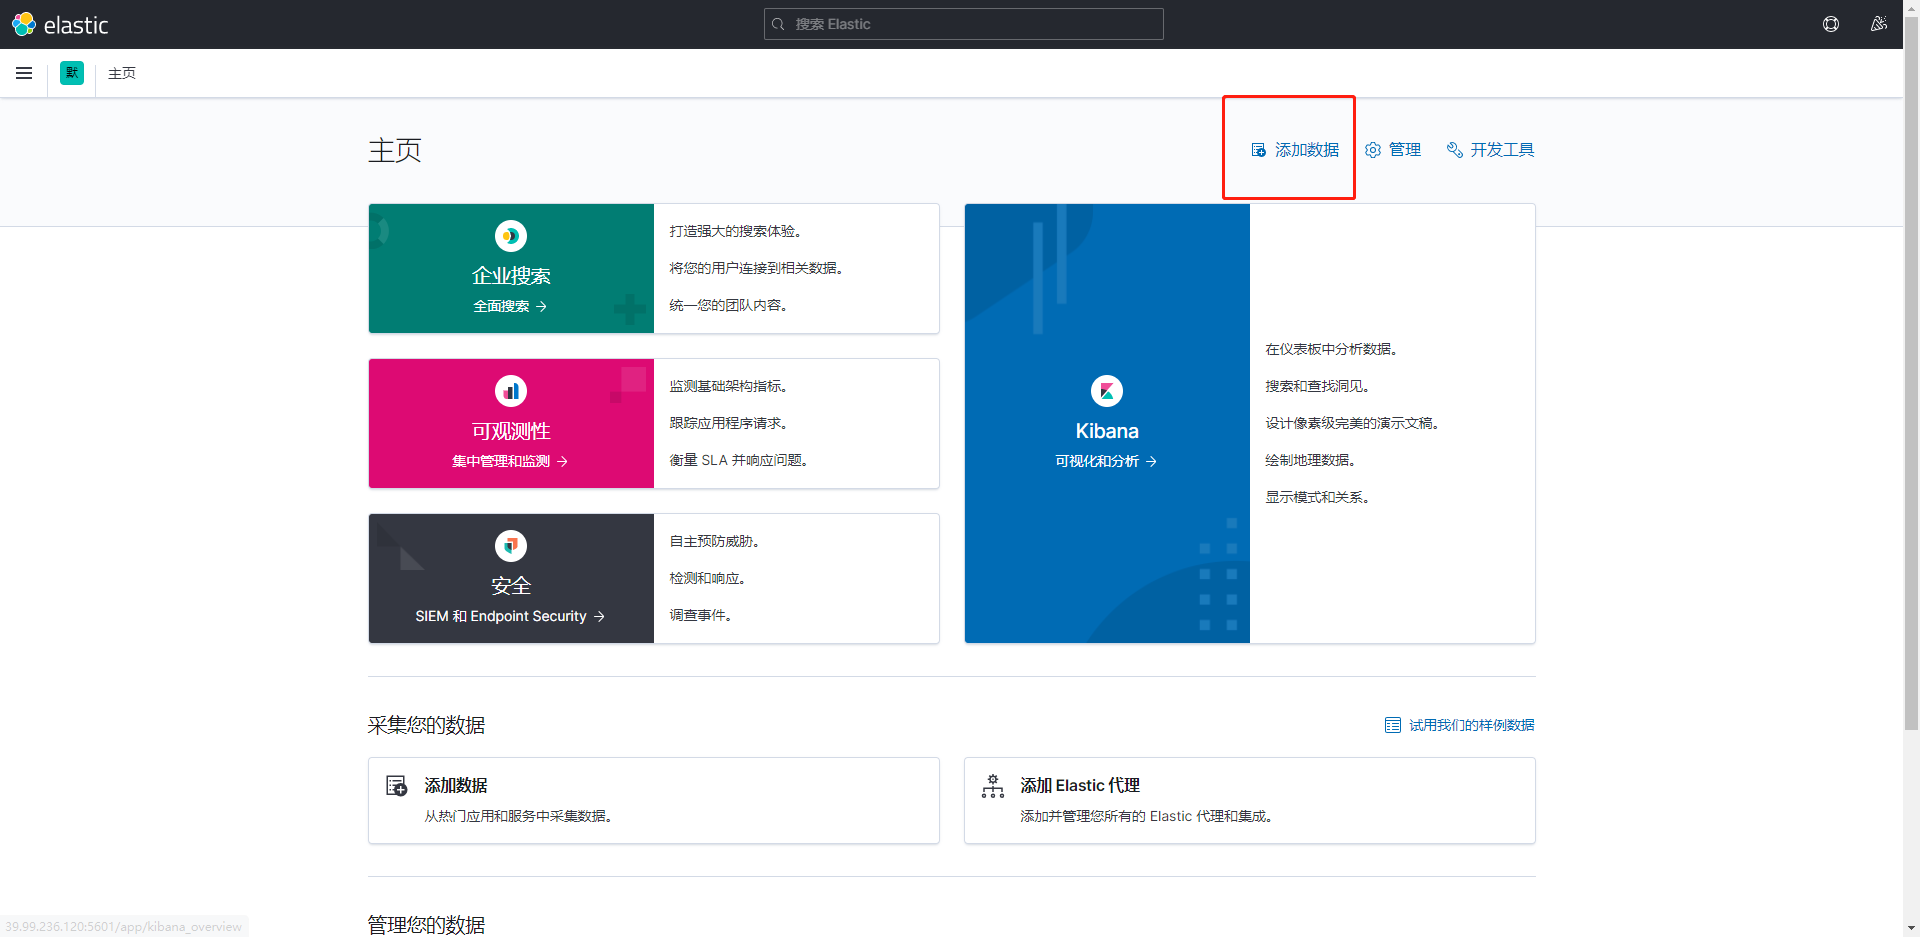
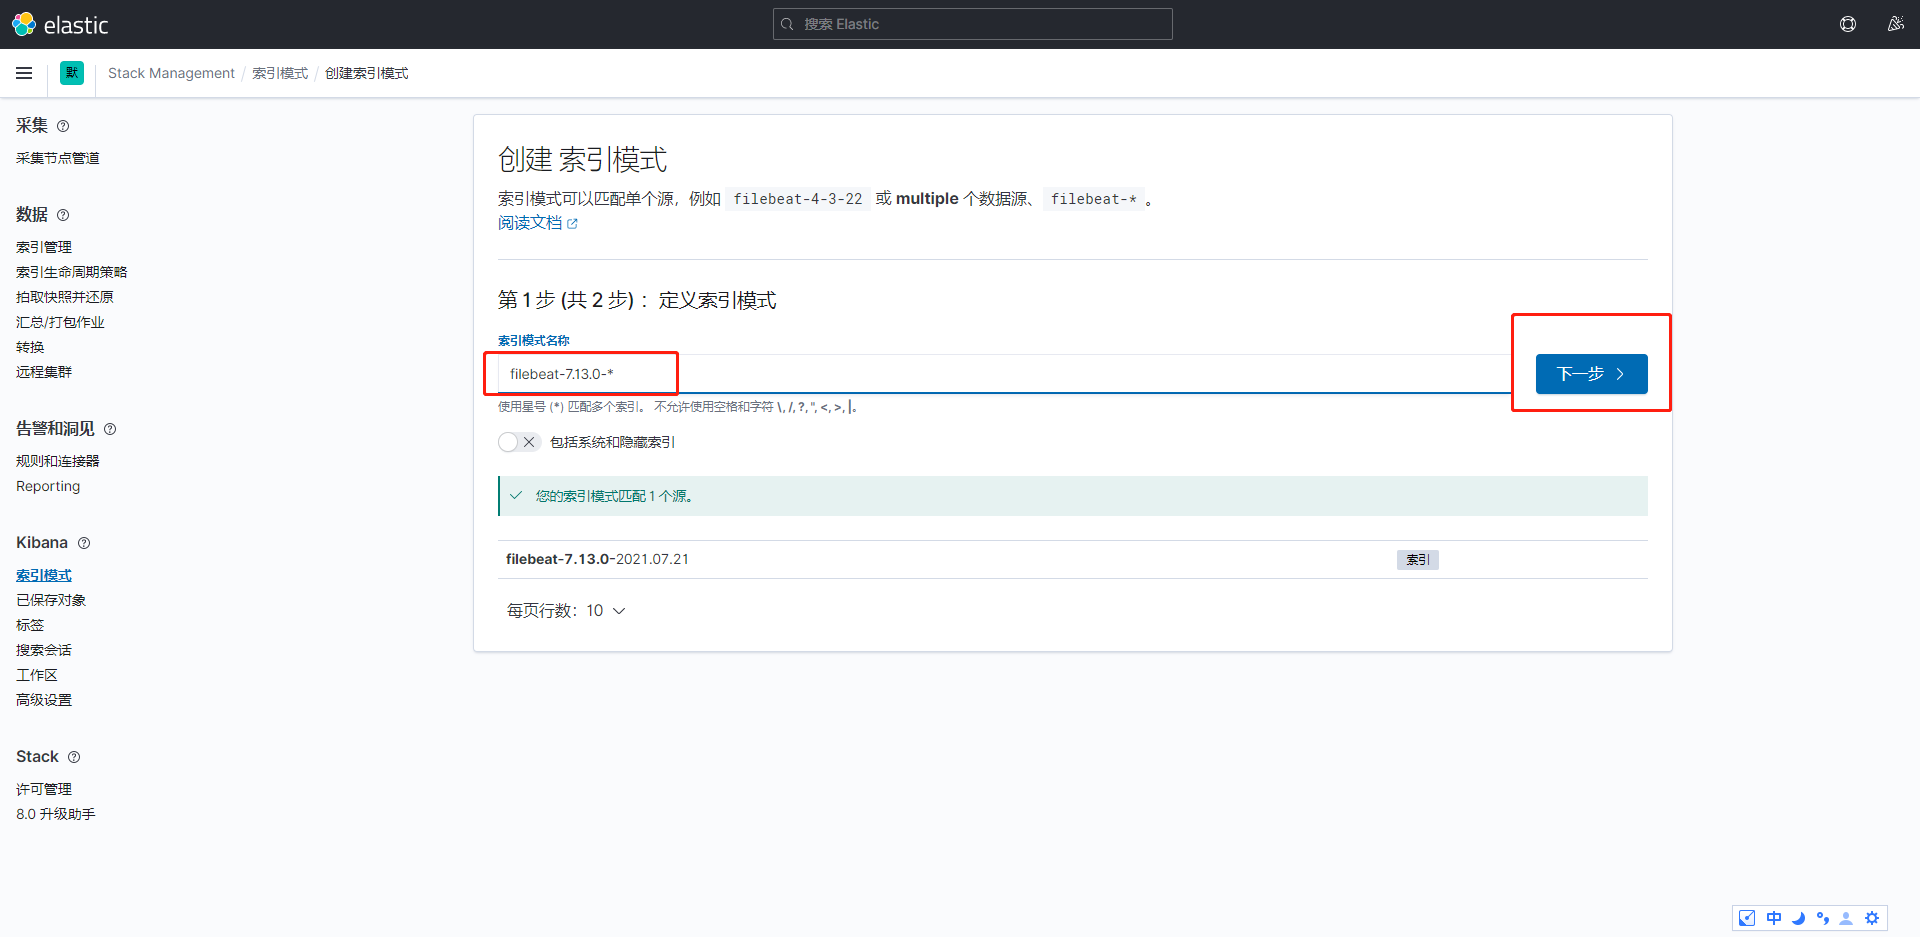
5.3 kibana配置
添加数据
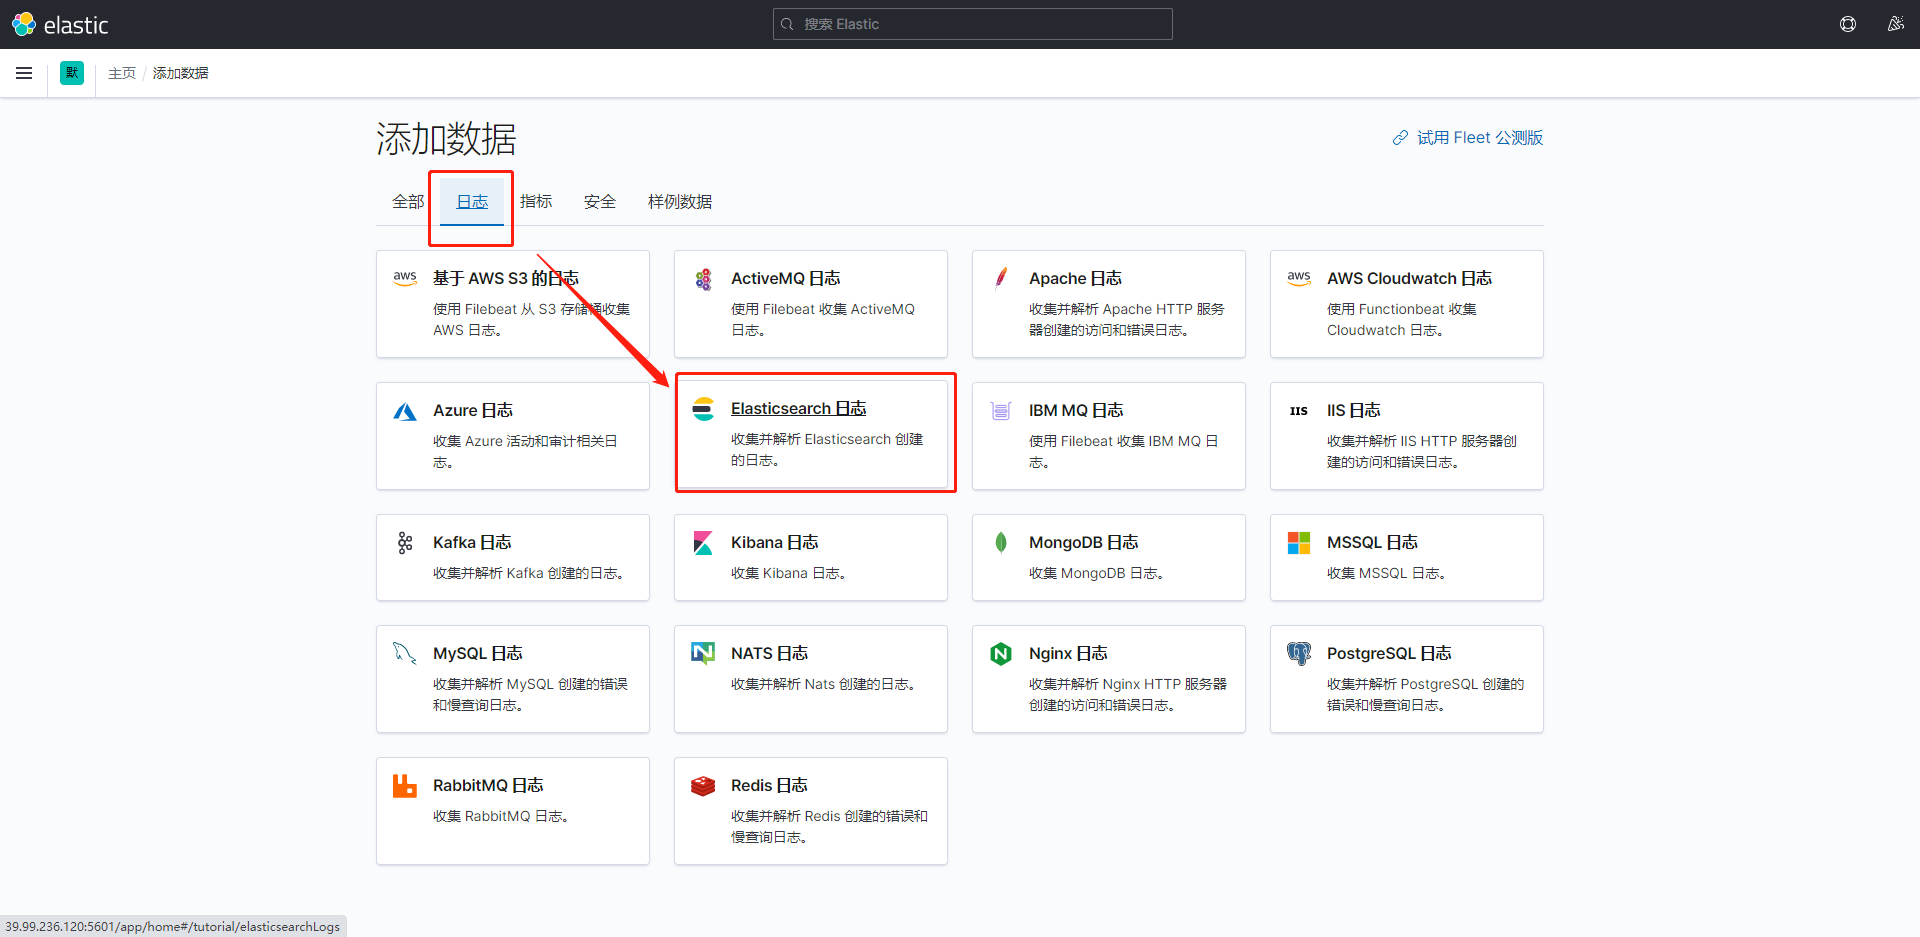
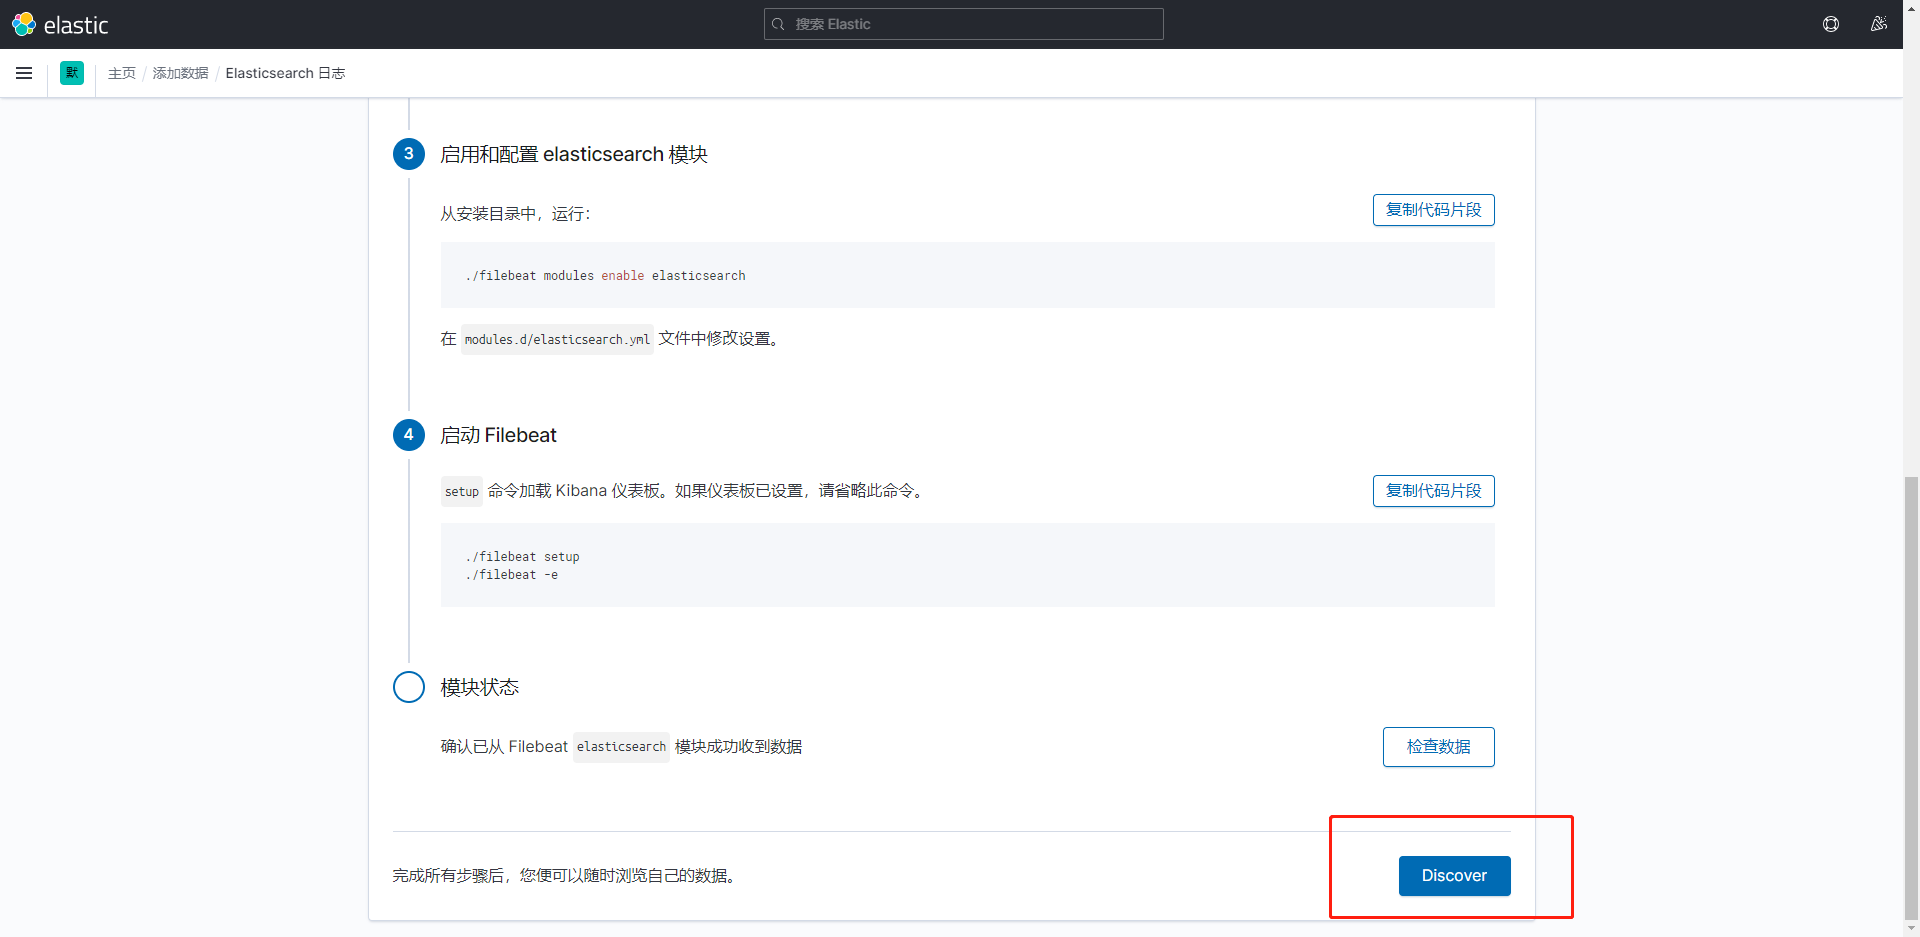
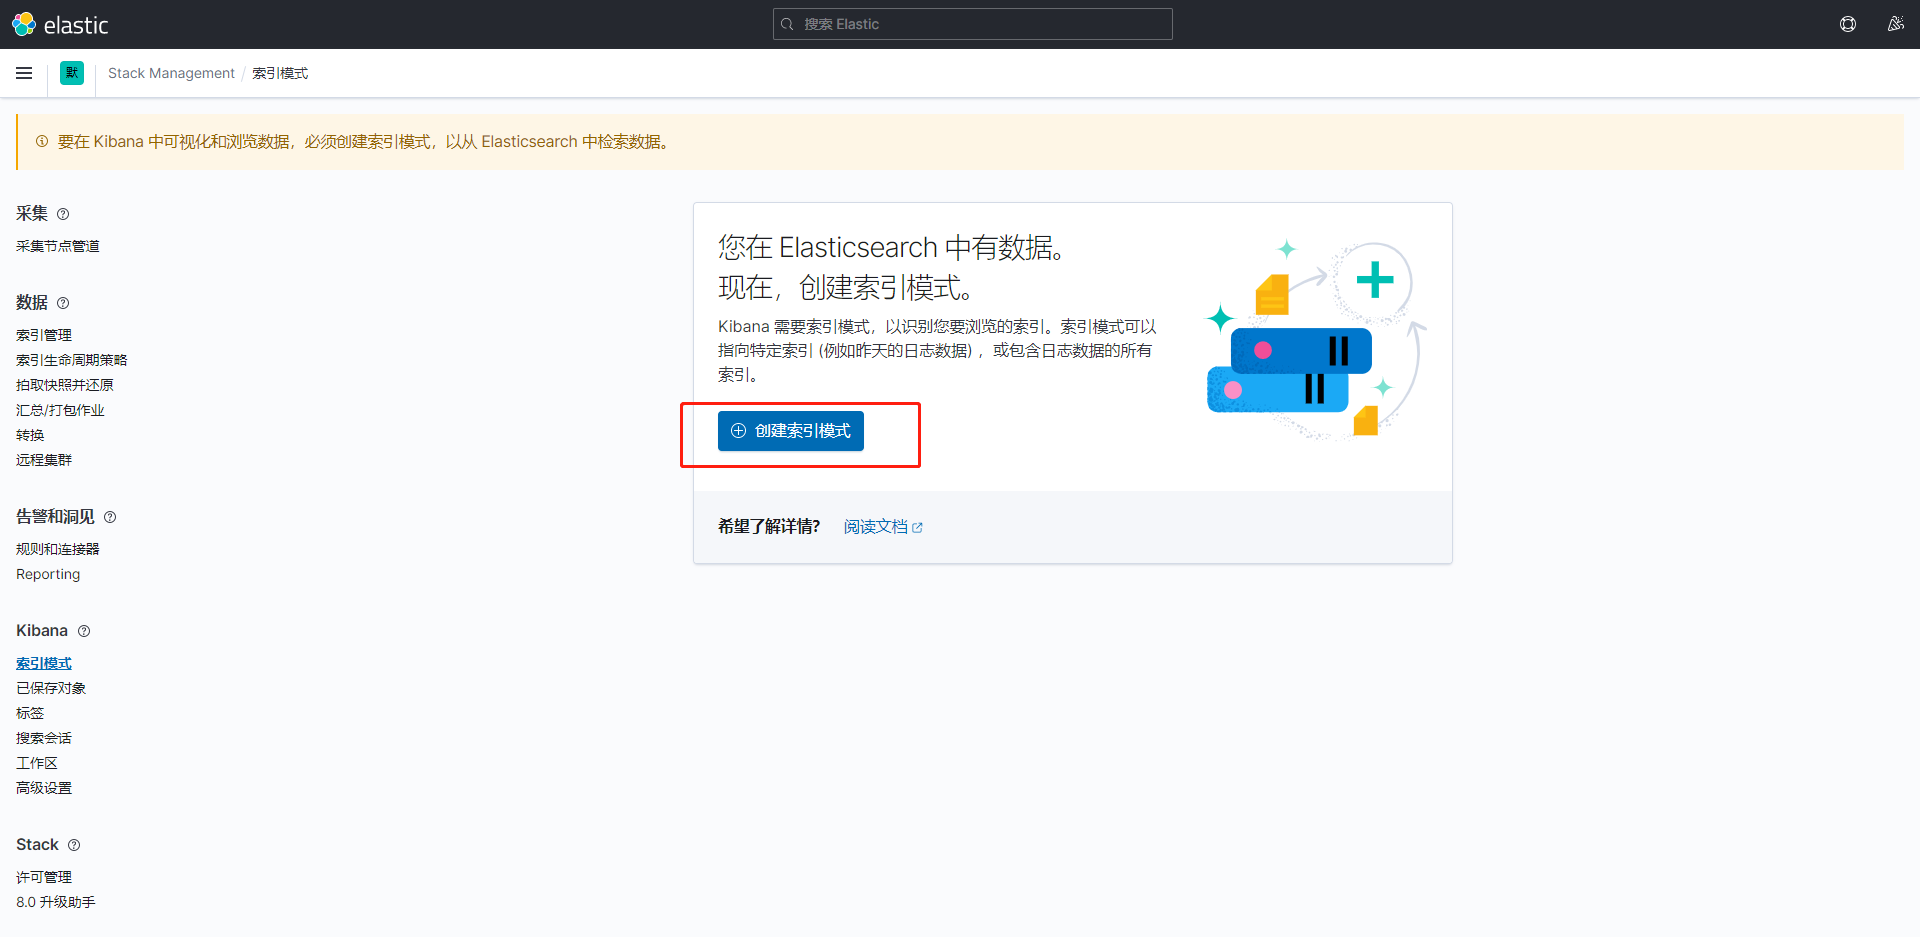
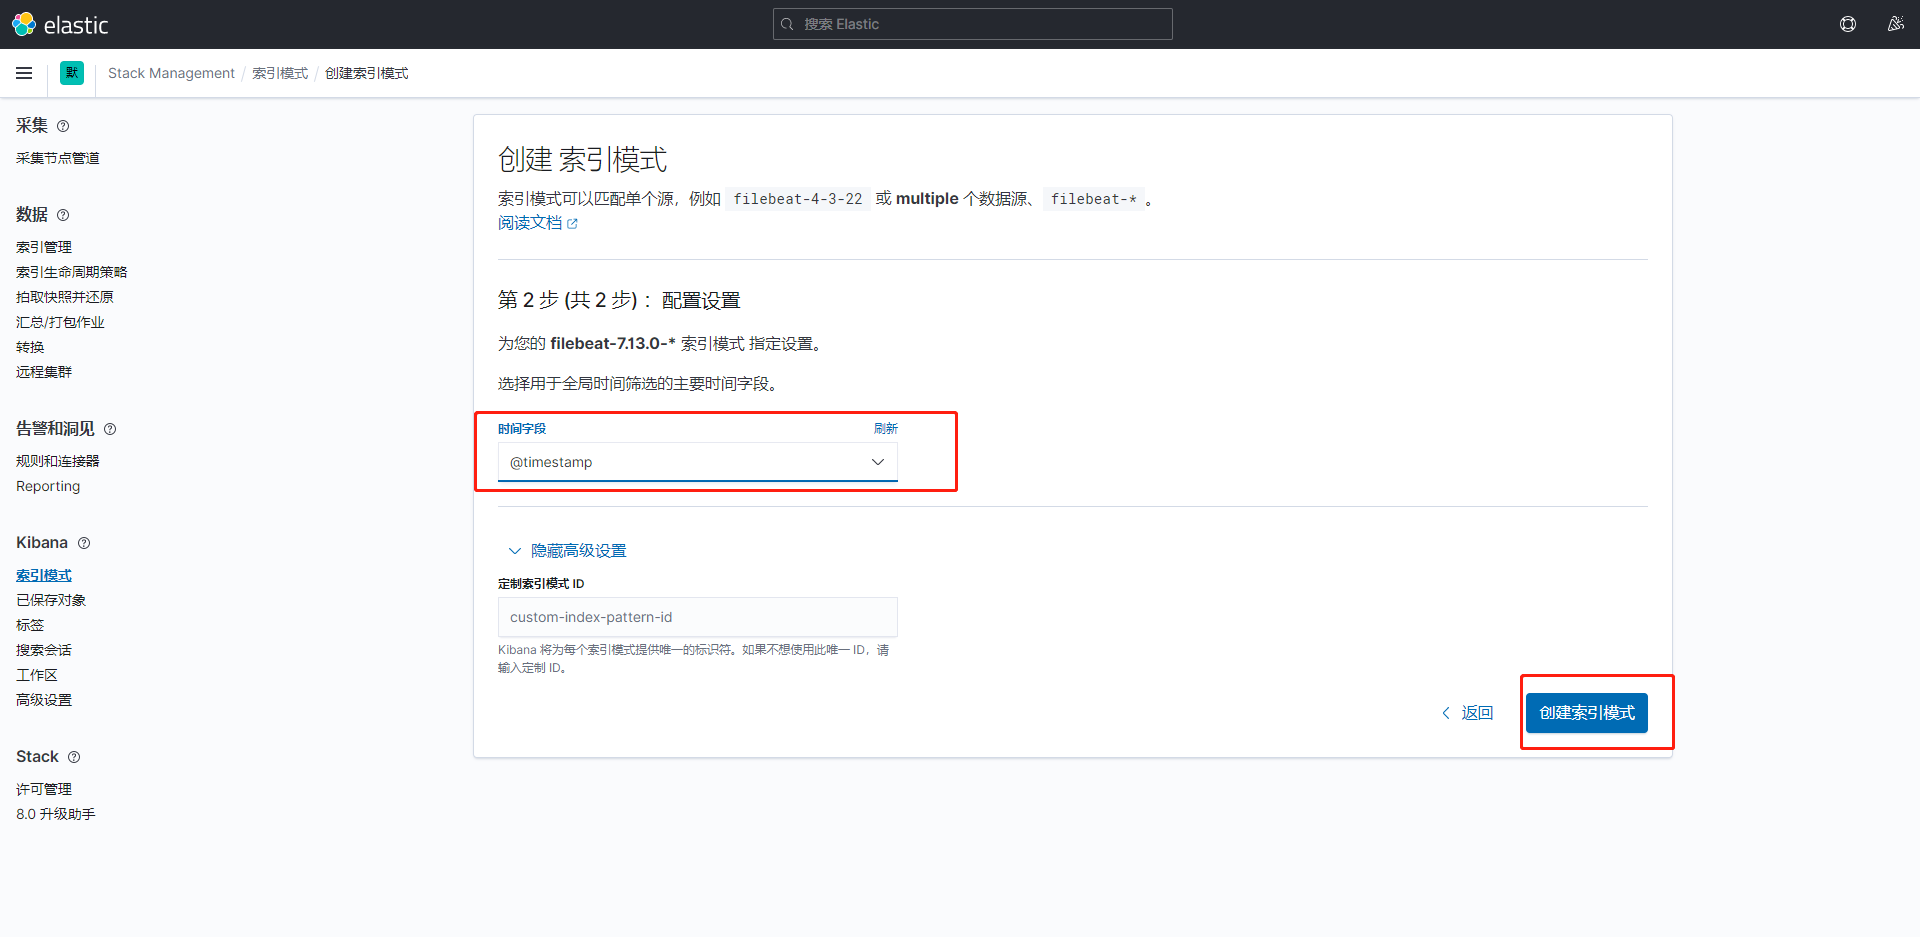
到这一步完成。
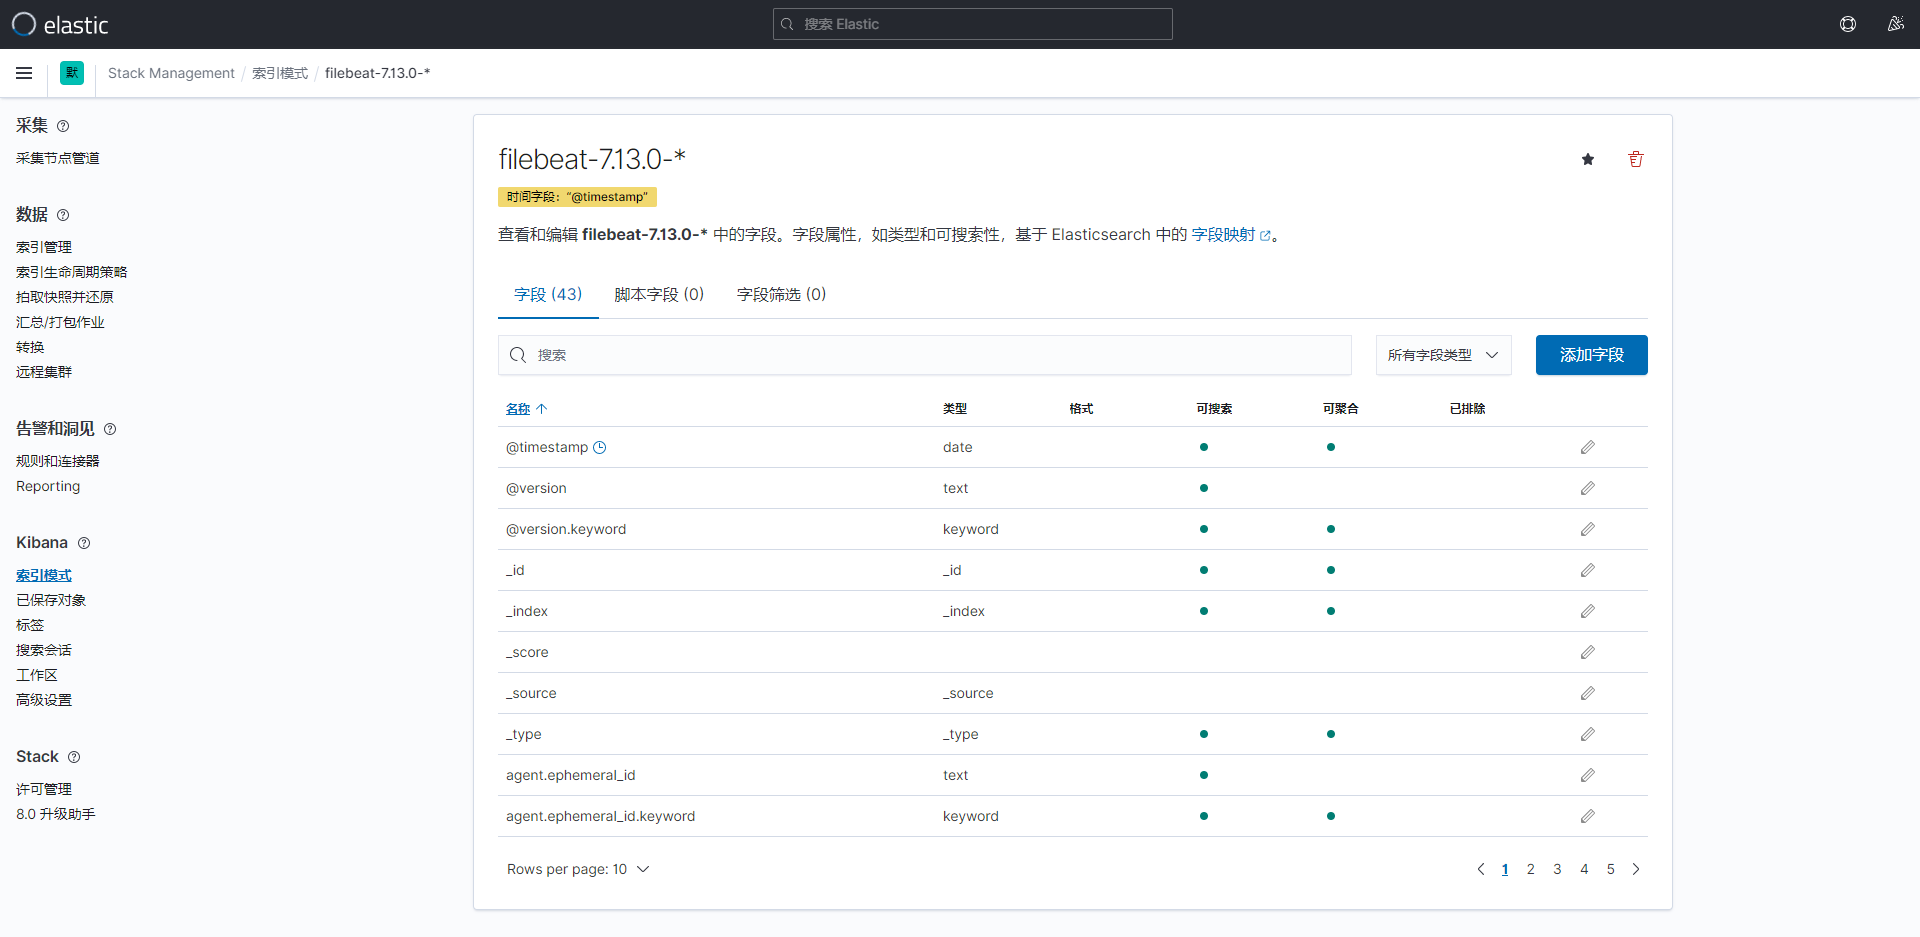
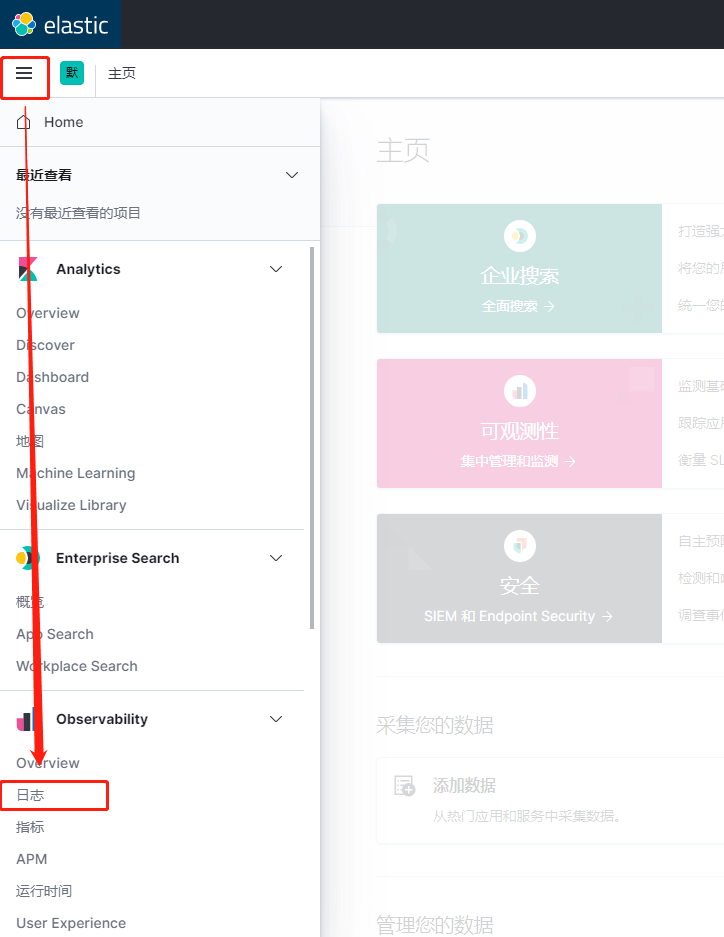
点击左边的菜单,点击日志
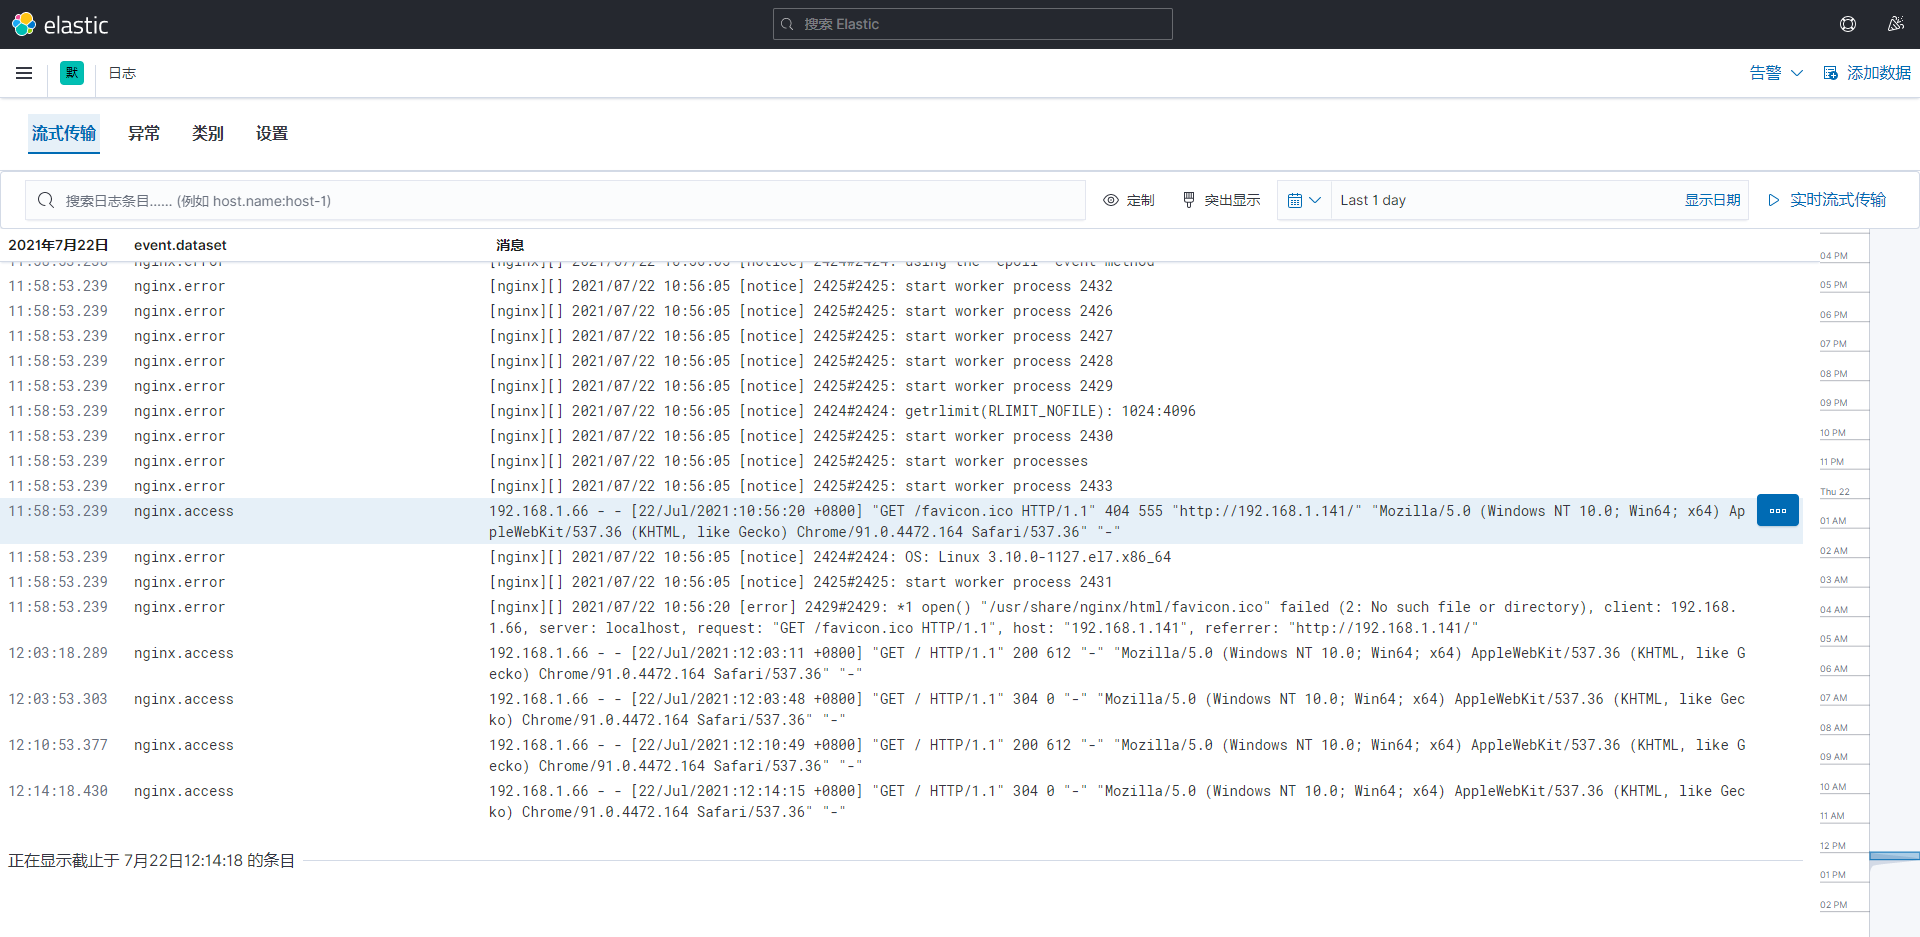
可以查看刚刚接入的日志流
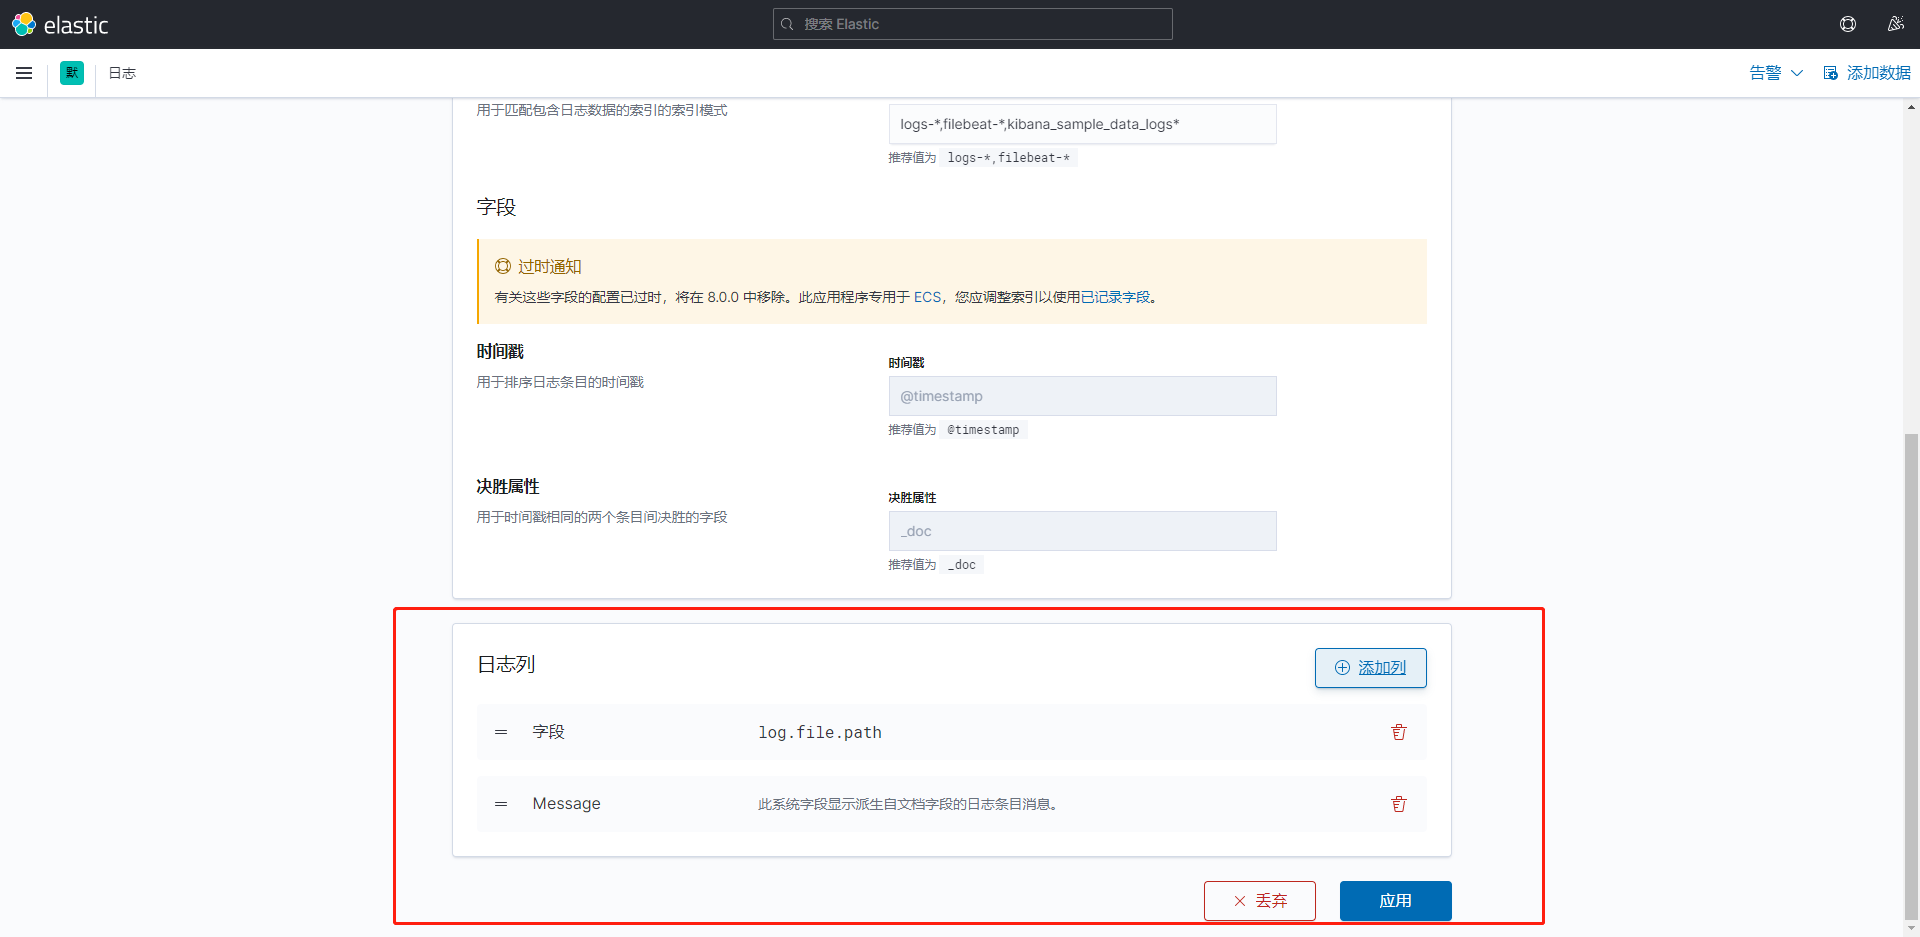
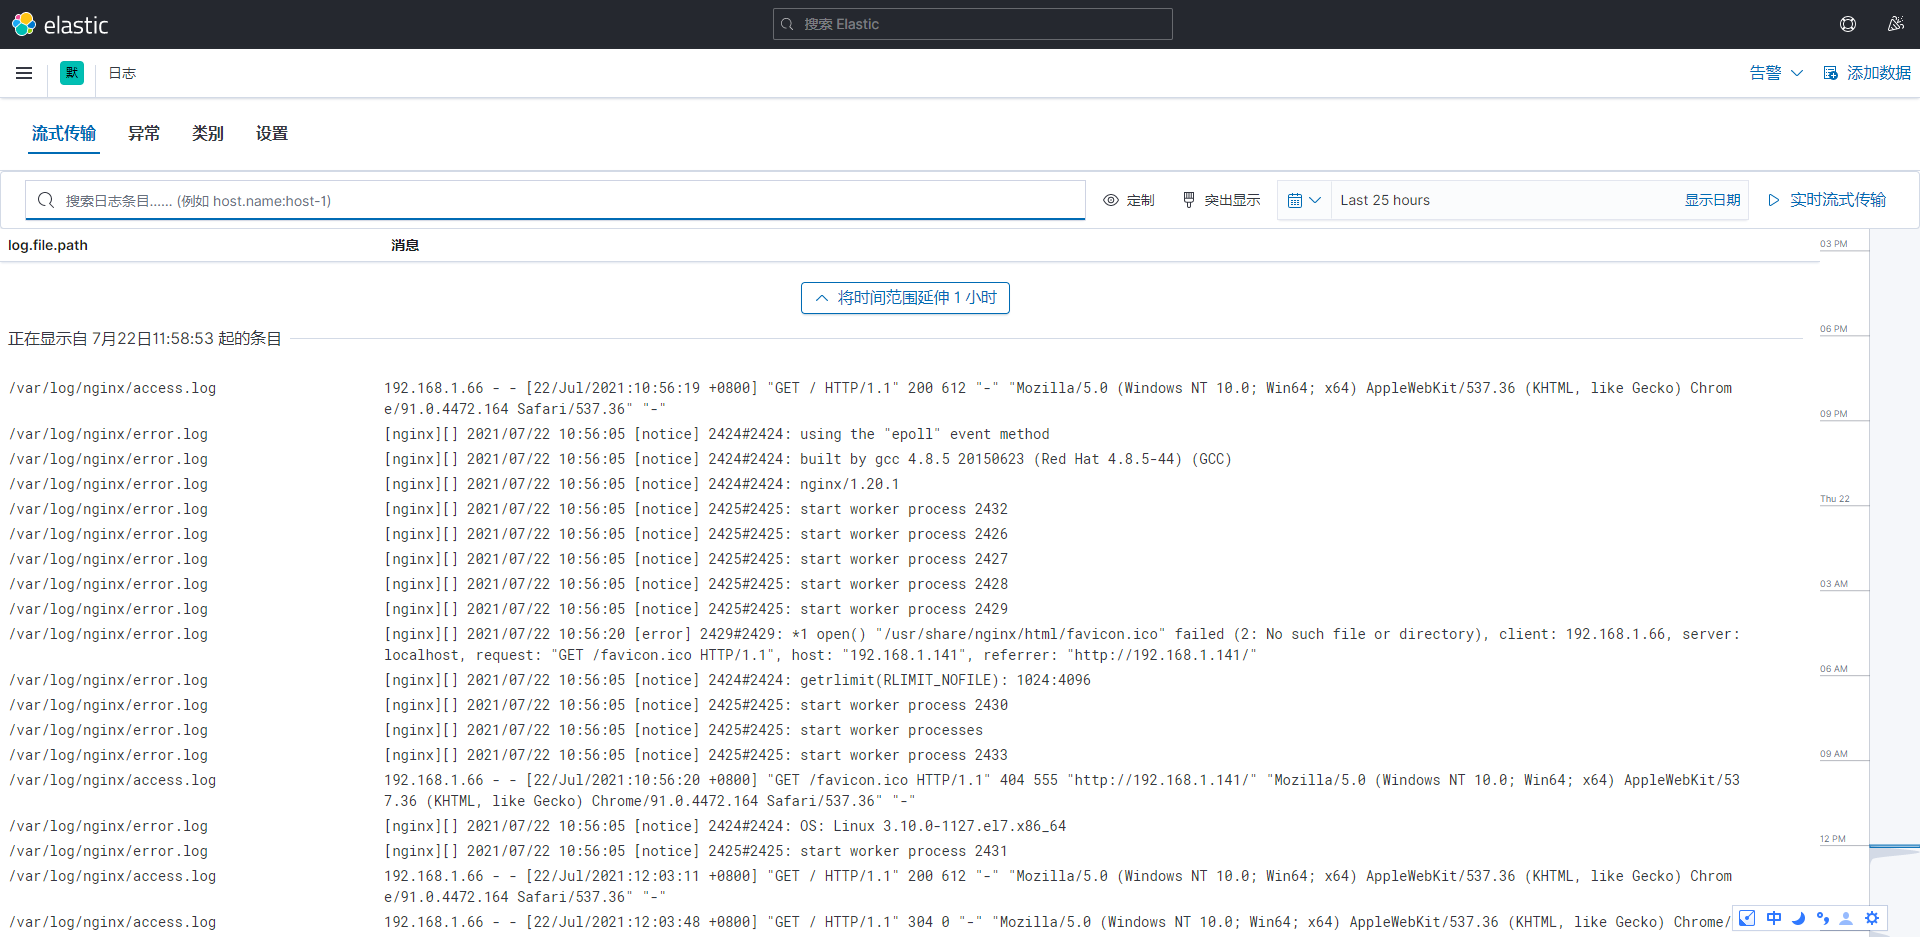
点击设置,可以设置显示的日志列
六、日志报警
等找到成熟方案再补 ☺