2021/10/18更新-Debug: System.NullReferenceException: 未将对象引用设置到对象的实例
这个错误我出过好几次,完全不长记性。。
它的神奇之处在于,报错的位置跟实际出错的地方不是同一行:)

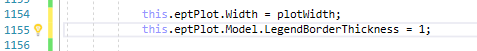
经过排查,我是1155行出错了,并不是1154行,也不是那之前的某行(当然如果你前面有错,还是要改的!)。前面是这样的:

因为我在1154行以后才将对象放到this.DataContext中,所以在那之前,eptPlot.Model肯定是空的,所以一定会报错:)
改正方法就是不用前台的对象,用后台的。比如:
_viewModel.EptPlotModel.LegendOrientation = LegendOrientation.Horizontal;
关于折线图,最终我还是放弃了InteractiveDataDisplay.WPF。原因是:1.资料好少,我不会改;2.自定义坐标轴始终搞不出来。
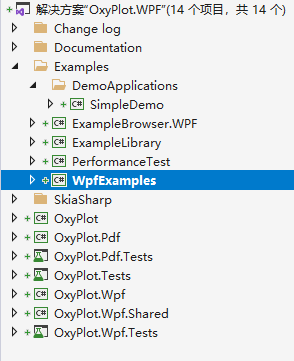
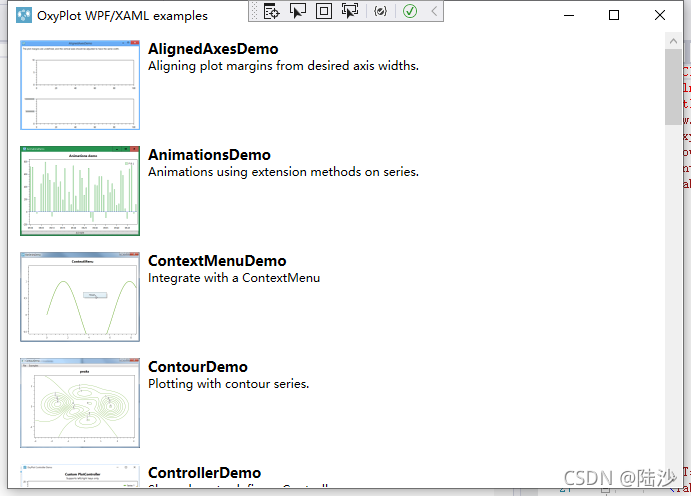
最终我换了oxyplot,但还是感觉emmm资料不够(文档好烂啊,也可能是我读得不够细致)。一些内容还是去扒了官方示例才搞清楚的。不过总算折腾得差不多了,所以记录一下注意事项。
基础
安装
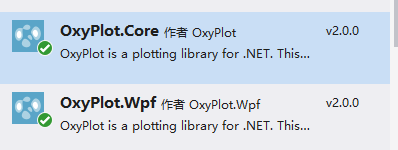
NuGet安装
文档和参考资料
官方文档:
https://oxyplot.readthedocs.io/en/latest/introduction/index.html
github(这个很有用!泪目):
https://github.com/oxyplot/oxyplot
入门:
https://zhuanlan.zhihu.com/p/374211133
公共属性介绍(坐标轴设置!很有用!):
http://dlgcy.com/oxyplot-wpf-public-props/
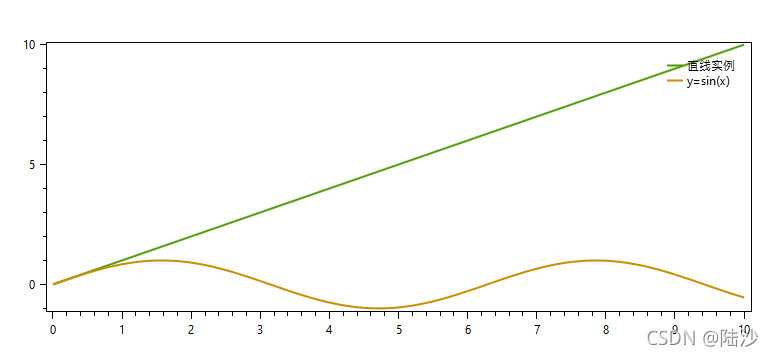
入门实例
后台
    public partial class WavePainter : Window
    {


        internal class PlotViewModel
        {


            public PlotModel SimplePlotModel {

     set; get; }
            public PlotViewModel()
            {


                SimplePlotModel = new PlotModel();
                //线条
                var lineSerial = new LineSeries() {

     Title = "直线实例" };
                lineSerial.Points.Add(new DataPoint(0, 0));
                lineSerial.Points.Add(new DataPoint(10, 10));
                SimplePlotModel.Series.Add(lineSerial);

                //函数sin(x)
                var funcSerial = new FunctionSeries((x) => {

     return Math.Sin(x); }, 0, 10, 0.1, "y=sin(x)");
                SimplePlotModel.Series.Add(funcSerial);
                //return SimplePlotModel;
            }
        }

        private PlotViewModel _viewModel;

		public WavePainter()
        {


            InitializeComponent();
            PlotViewModel _viewModel = new PlotViewModel();
            //画直线
            this.DataContext = _viewModel;
            ...
        }
    }
前台
<Window ...
		...
        xmlns:oxy="http://oxyplot.org/wpf">
	<Grid>
		<oxy:PlotView Model="{Binding Path= SimplePlotModel}"></oxy:PlotView>
	</Grid>
</Window>
正式绘图
xaml中的设置:加拖动条
    <Grid x:Name="myGrid">
    	<!--加拖动条-->
        <ScrollViewer HorizontalScrollBarVisibility="Visible"
				VerticalScrollBarVisibility="Visible" Margin="10,0,10,10">
            <oxy:PlotView x:Name="myPlot" Model="{Binding Path= SimplePlotModel}"
					  HorizontalAlignment="Left" VerticalAlignment="Center">
            </oxy:PlotView>
        </ScrollViewer>
    </Grid>
xaml中的设置:定义颜色
    <Window.Resources>
        <!-- 定义几种颜色 -->
        <SolidColorBrush x:Key="LineColorA" Color="#60D257" />
    </Window.Resources>
    ...
	Background="{StaticResource LineColorA}"
xaml中的设置:定义tracker
一条线上有好多点,点击上面的某个点,出现的东西就是tracker。如果有多条线,需要多个tracker,那么给每个tracker以不同的TrackerKey即可。
<!--标记-->
<oxy:PlotView.TrackerDefinitions>
    <oxy:TrackerDefinition TrackerKey="TrackerA">
        <oxy:TrackerDefinition.TrackerTemplate>
            <ControlTemplate>
                <Canvas>
                    <StackPanel Orientation="Horizontal" Canvas.Left="{Binding Position.X}" Canvas.Top="{Binding Position.Y}">
                        <TextBlock Foreground="White" Text="{Binding Item}"/>
                    </StackPanel>
                </Canvas>
            </ControlTemplate>
        </oxy:TrackerDefinition.TrackerTemplate>
    </oxy:TrackerDefinition>
    ...
</oxy:PlotView.TrackerDefinitions>
<!--标记结束-->
c#的设置为:
var AreaSeriala = new AreaSeries() {


    Title = "A",
    ItemsSource = pa,
    DataFieldX = "X",
    DataFieldY = "Y",
    Color = OxyColor.Parse("#4169E8"),
    Fill = OxyColor.FromArgb(30,0,0,255),
    StrokeThickness = 1,
    TrackerKey = "TrackerA",
    TrackerFormatString = "{0} {2} {4}",
    CanTrackerInterpolatePoints = false,
};
说明:
- AreaSeries就是线条下带填充色块的那种;
- pa是一个List,T类里有成员变量X和Y,以此指定x和y轴的数据来源;
- OxyColor.Parse和FromArgb是两种获取颜色的方法,后者第一个参数是透明度;
- TrackerFormatString设置的是tracker中字符串的格式。其中{0}是Series的Title,{1}是x轴的Title,{2}是x值,{3}是y轴的Title,{4}是y值;
- CanTrackerInterpolatePoints设为false,表示在没有数据点的位置,不另外计算数值。