算法,参数,输出。
Peak calling

ChIP-seq实验,从比对文件中观察到正/负链上以结合位点为中心的非对称reads
密度。
For ChIP-seq experiments, what we observe from the alignment files is a strand asymmetry with read densities on the +/- strand, centered around the binding site. The 5’ ends of the selected fragments will form groups on the positive- and negative-strand. The distributions of these groups are then assessed using statistical measures and compared against background (input or mock IP samples) to determine if the site of enrichment is likely to be a real binding site.

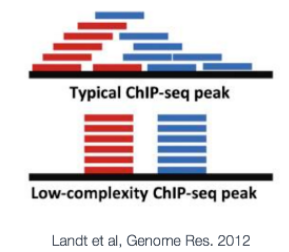
ChIP-seq analysis algorithms are specialized in identifying one of two types of enrichment (or have specific methods for each): broad peaks or broad domains (i.e. histone modifications that cover entire gene bodies) or narrow peaks ( transcription factor binding). Narrow peaks are easier to detect as we are looking for regions that have higher amplitude and are easier to distinguish from the background, compared to broad or dispersed marks. There are also ‘mixed’ binding profiles which can be hard for algorithms to discern. An example of this is the binding properties of PolII, which binds at promotor and across the length of the gene resulting in mixed signals (narrow and broad).
NOTE:ChIP-seq的分析方法可以鉴定两种类型的富集模式:broad domains和narrow peaks。broad domains,如组蛋白修饰在整个基因body区域的分布;narrow peak,如转录因子的结合。narrow peak相对于broad 或者分散的marks更易被检测到。也有一些混合的结合图谱,如PolII包括narrow和broad信号。
MACS2
MACS2是最常用的call peaks工具。 The MACS algorithm captures the influence of genome complexity to evaluate the significance of enriched ChIP regions。全称Model-based Analysis of ChIP-Seq,最初设计用来鉴定转录因子结合位点(also suited for larger regions),也可用于其他类型的富集方式测序。
MACS通过整合序列标签位置信息和方向信息提高结合位点的空间分辨率( improves the spatial resolution of binding sites through combining the information of both sequencing tag position and orientation)。单独使用或加对照( increases specificity of the peak calls)。

1. Remove redundancy
Why worry about duplicates? Reads with the same start position are considered duplicates. These duplicates can arise from experimental artifacts, but can also contribute to genuine ChIP-signal. (相同起点的reads被认为是duplicates,可能由于实验误差造成,也可能是ChIP信号)
坏 duplicates: If initial startingmaterial is lowthis can lead tooveramplificationof this material before sequencing. Anybiases in PCRwill compound this problem and can lead toartificially enriched regions. Alsoblacklisted (repeat) regionswith ultra high signal will also be high in duplicates.Masking these regionsprior to analysis can help remove this problem。 实验材料量少,过度扩增,PCR偏差,人为富集区域。blacklist(重复)区域?怎么获得,屏蔽该区域。好 duplicates: You can expect somebiological duplicates with ChIP-seqsince you are only sequencing a smallpart of the genome. This number can increase if your depth of coverage is excessive or if your protein only binds to few sites. If there are a good proportion of biological dupicates,removalcan lead to anunderestimation of the ChIP signal. 有ChIP-seq意义的生物学意义duplicates ,测序基因组小部分。覆盖深度过多,蛋白质与少数位点结合,duplicates会增加。去除此类会导致对ChIP信号的低估。- Consider your
enrichment efficiencyandsequencing depth. Try todiscriminatevia genome browser of your non-deduplicated data. Bona fide peaks will havemultiple overlappingreads withoffsets, while samples with only PCR duplicates will stack up perfectly without offsets. A possible solution to distinguishing biological duplicate from PCR artifact would be to include UMIs into your experimental setup. 考虑富集效率和测序深度。通过基因组浏览器区别。真正的峰会有多个重叠reads和偏移量,PCR重复没有偏移量。如何区分:实验设计考虑UMIs(UMI将被用于合并PCR复制物)。 - Retain duplicates for differential binding analysis. 保留duplicates 用于差异结合分析
why?retain和keep区别? - If you are expecting binding in repetitive regions, use paired-end sequencing and keep duplicates. 研究重复区域,使用pariedend测序并
保持重复? - call peak之前就remove dup
2.0 Shift size d
- 真实结合位点周围的tag density应显示
双峰富集(成对峰)。MACS利用这种双峰模式empirically model the shifting size,精确定位结合位点。 - 为了找到
成对峰来构建模型,MACS首先扫描整个数据集,寻找高度显著富集区域。只利用ChIP样本,给定超声大小sonication size(bandwidth)和high-confidence fold-enrichment(mfold), MACSslides two bandwidth windowsacross the genome to findregions with tags more than mfold enrichedrelative to arandom tag genome distribution. - MACS
随机抽取1000个高质量峰,分离正链和负链标签,aligns them by the midpoint between their centers。Thedistance between the modes of the two peaks in the alignment is defined as ‘d’and represents the estimated fragment length. MACS shifts all the tags by d/2 toward the 3’ ends to the most likely protein-DNA interaction sites.

2. Select 1000 regions with a 10- to 30-fold enrichment relative to the genome background
3. Build model and estimate DNA fragment size d
4. Shift reads toward 3’end by d
5. Scale two libraries(if have control)
For experiments in which sequence depth differs between input and treatment samples, MACS linearly scales the total control tag count to be the same as the total ChIP tag count. The default behaviour is for the larger sample to be scaled down.
6.0 Effective genome length
To calculate λBG from tag count, MAC2 requires the effective genome size or the size of the genome that is mappable. Mappability is related to the uniqueness of the k-mers at a particular position the genome. Low-complexity and repetitive regions have low uniqueness, which means low mappability. Therefore we need to provide the effective genome length to correct for the loss of true signals in low-mappable regions. 提供有效基因组长度,以纠正低定位区域真实信号丢失。
如何获得?The MACS2 software has some pre-computed values for commonly used organisms (human, mouse, worm and fly,rice?). more accurate values? The deepTools docs has additional pre-computed values for more recent builds but also has some good materials on how to go about computing it.
6. Call candidate peaks relative to genome background
After MACS shifts every tag by d/2, it then slides across the genome using a window size of 2d to find candidate peaks. The tag distribution along the genome can be modeled by a Poisson distribution. The Poisson is a one parameter model, where the parameter λ is the expected number of reads in that window.
7. Calculate dynamic λ for candidate peaks
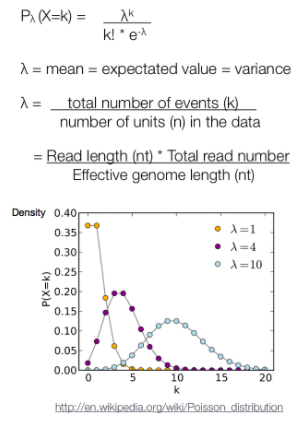
泊松分布的参数λ是单位时间(或单位面积)内随机事件的平均发生次数。 泊松分布的期望和方差均为λ.
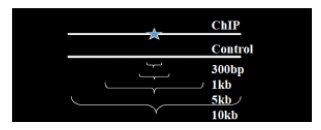
Instead of using a uniform λ estimated from the whole genome, MACS uses a dynamic parameter, λlocal, defined for each candidate peak. The lambda parameter is estimated from the control sample and is deduced by taking the maximum value across various window sizes:
λlocal = max(λBG, λ1k, λ5k, λ10k).
In this way lambda captures the influence of local biases, and is robust against occasional low tag counts at small local regions. Possible sources for these biases include local chromatin structure, DNA amplification and sequencing bias, and genome copy number variation. 通过使用动态lambda捕获局部偏差的影响,并且对小局部区域中偶尔出现的low tag counts表现较好。偏差可能来源包括局部染色质结构、DNA扩增和测序偏差以及基因组拷贝数变化。
A region is considered to have a significant tag enrichment if the p-value < 10e-5 (可设置). This is a Poisson distribution p-value based on λ.
Overlapping enriched peaks are merged, and each tag position is extended ‘d’ bases? from its center. The location in the peak with the highest fragment pileup堆积, hereafter referred to as the summit峰顶, is predicted as the precise binding location. The ratio between the ChIP-seq tag count and λlocal? is reported as the fold enrichment.
8. Calculate P value and filter candidate peaks
9. Calculate FDR by exchanging treatment and control
Each peak is considered an independent test and thus, when we encounter thousands of significant peaks detected in a sample we have a multiple testing problem. In MACSv1.4, the FDR was determined empirically by exchanging the ChIP and control samples. However, in MACS2, p-values are now corrected for multiple comparison using the Benjamini-Hochberg correction.
MACS2 参数
1. Input file options
-t: The IP data file (this is the only REQUIRED parameter for MACS) 实验组-c: Control or mock data 对照-f: 输入文件格式,默认值“AUTO” ,bam sam bed-g:mappable genome sizewhich is defined as the genome size which can be sequenced; some precompiled values provided.- hs: 2.7e9人类基因组有效大小(UCSC human hg18 assembly)
2. Output arguments
-outdir: 输出文件夹-n: 文件前缀-B/--bdg: store the fragment pileup, control lambda, -log10pvalue and -log10qvalue scores in bedGraph files 输出bedgraph格式的文件
3. Shifting model arguments
-s:size of sequencing tags. Default, MACS will use thefirst 10 sequencesfrom your input treatment file to determine it--bw: The bandwidth which is used toscan the genomeONLY for model building. Can be set to the expected sonication fragment size.--mfold:upper and lower limitfor model building--nomodel:和extsize、shift是配套使用,有这个参数才可设置extsize和shift。--extsize:当设置了nomodel时,MACS会用–extsize这个参数从5'->3'方向扩展reads修复fragments。如转录因子结合范围200bp,设置这个参数是200。--shift:当设置了–nomodel,MACS用这个参数从5' 端移动剪切,然后用–extsize延伸,如果–shift是负值表示从3’端方向移动。建议ChIP-seq数据集这个值保持默认值为0?,对于检测富集剪切位点如DNAseq数据集设置为EXTSIZE的一半。
想找富集剪切位点,如DNAse-seq,所有5'端的序列reads应该从两个方向延伸,如果想设置移动的窗口是200bp,参数设置如下:
--nomodel --shift -100 --extsize 200
对nucleosome-seq数据,用核小体大小的一半进行extsize,所以参数设置如下:
--nomodel --shift 37 --extsize 73
ATAC-seq关心的是在哪切断,断点才是peak的中心,所以使用shift模型,–shift -75或-100
对人细胞系ATAC-seq 数据call peak的参数设置:
macs2 callpeak -t H1hesc.final.bam -n sample --shift -100 --extsize 200 --nomodel -B --SPMR -g hs --outdir Macs2_out 2> sample.macs2.log
4. Peak calling arguments
-q: q-value (minimum FDR) cutoffq value默认值是0.05,与pvalue不能同时使用。-p: p-value cutoff (instead of q-value cutoff)--nolambda: do not consider the local bias/lambda at peak candidate regions。不要考虑在峰值候选区域的局部偏差/λ--broad: broad peak calling,narrow peak和broad peak
Relaxing the q-value does not behave as expected in this case since it is partially tied to peak widths. Ideally, if you relaxed the thresholds, you would simply get more peaks but with MACS2 relaxing thresholds also results in wider peaks. q值与峰宽有一定的联系。理想情况下,如果放宽阈值,您将简单地获得更多的峰值,但是使用MACS2放松阈值也会导致更宽的峰值。
macs2 callpeak -t bowtie2/H1hesc_Nanog_Rep1_aln.bam \
	-c bowtie2/H1hesc_Input_Rep1_aln.bam \
 	-f BAM -g 1.3e+8 \
	-n Nanog-rep1 \
	--outdir macs2 2> macs2/Nanog-rep1-macs2.log
MACS2 Output files
narrowPeak
A narrowPeak (.narrowPeak) file is used by the ENCODE project to provide called peaks of signal enrichment based on pooled, normalized (interpreted) data. It is a BED 6+4 format, which means the first 6 columns of a standard BED file with 4 additional fields:

WIG format
Wiggle format (WIG) allows the display of continuous-valued data in a track format. Wiggle format is line-oriented. It is composed of declaration lines and data lines, and require a separate wiggle track definition line. There are two options for formatting wiggle data: variableStep and fixedStep. These formats were developed to allow the file to be written as compactly as possible.
BedGraph format
The BedGraph format also allows display of continuous-valued data in track format. This display type is useful for probability scores and transcriptome data. This track type is similar to the wiggle (WIG) format, but unlike the wiggle format, data exported in the bedGraph format are preserved in their original state. For the purposes of visualization, these can be interchangeable.
-
_peaks.narrowPeak: BED6+4 format file which contains the peak locations together with peak summit, pvalue and qvalue。BED6+4格式,可以上传到UCSC浏览。- 1:染色体号
- 2:peak起始位点
- 3:结束位点
- 4:peak name
- 5:int(-10*log10qvalue)
- 6 :正负链
- 7:fold change
- 8:-log10pvalue
- 9:-log10qvalue
- 10:relative summit position to peak start(?)
-
_peaks.xls: a tabular file which contains information about called peaks. Additional information includes pileup and fold enrichment。含peak信息的tab分割的文件,前几行显示callpeak命令。- 染色体号
- peak起始位点
- peak结束位点
- peak区域长度
- peak的峰值位点(summit position)
- peak 峰值的高度(pileup height at peak summit, -log10(pvalue) for the peak summit)
- peak的富集倍数(相对于random Poisson distribution with local lambda)
- XLS里的坐标和bed格式的坐标还不一样,起始坐标需要减1才与narrowPeak的起始坐标一样。
-
_summits.bed: peak summits locations for every peak. To find the motifs at the binding sites, this file is recommended。BED格式的文件,包含peak的summits位置,第5列是-log10pvalue。如果想找motif,推荐使用此文件。 -
_model.R: an R script which you can use to produce a PDF image about the model based on your data and cross-correlation plot -
_control_lambda.bdg: bedGraph format for input sample -
_treat_pileup.bdg: bedGraph format for treatment sample。bedGraph格式,可以导入UCSC或者转换为bigwig格式。两种bfg文件:treat_pileup, and control_lambda. -
NAME_peaks.broadPeak: BED6+3格式与narrowPeak类似,只是没有第10列。
R作图the first plot illustrates the distance between the modes from which the shift size was determined?

The second plot is the cross-correlation plot. This is a graphical representation of the Pearson correlation of positive- and negative- strand tag densities, shifting the strands relative to each other by increasing distance?
xls文件
文件包含信息还是比较多的,和narrowPeak唯一不同的是peak的起始位置需要减1才是bed格式的文件,另外还包含fold_enrichment 和narrowPeak的fold change 对应,-log10pvalue,-log10qvalue,peak长度,peak 峰值位置等。
narrowPeak文件
和xls文件信息类似
summits.bed文件
包含峰的位置信息和-log10pvalue
bdg文件
bdg文件适合导入UCSC或IGV进行谱图可视化,或者转换为bigwig格式再进行可视化。