matplotlib.pyplot.subplots(nrows=1, ncols=1, **fig_ kw)创建一个 带有多个axes(坐标系/绘图区)的图
基本参数
Parameters:
nrows, ncols :设置有几行几列坐标系
int, optional, default: 1, Number of rows/columns of the subplot grid.
Returns:
fig :图对象
axes :返回相应数量的坐标系
设置标题等方法不同:
set_ xticks
set_ _yticks
set_ xlabel
set_ ylabel
代码如下:
import matplotlib.pyplot as plt
import random
# 0.准备数据
x = range(60)
y_shanghai = [random.uniform(45, 18) for i in x]
y_beijing = [random.uniform(1, 5) for i in x]
# 1.创建画布
# plt.figure(figsize=(20, 8), dpi=100)
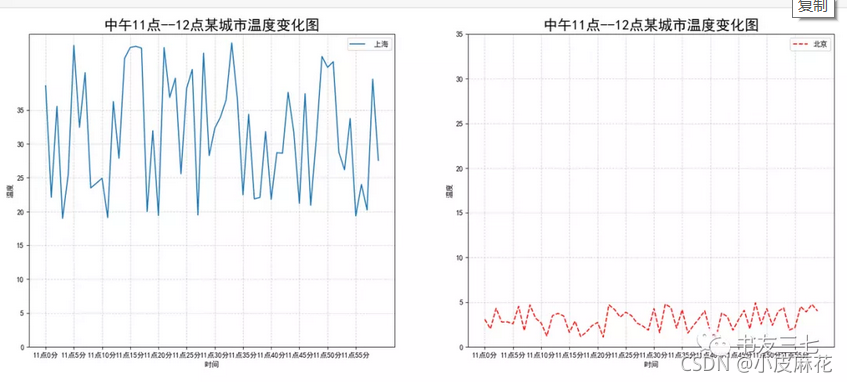
fig, axes = plt. subplots (nrows=1, ncols=2, figsize=(20, 8),dpi=100)
# 2.绘制图像
# plt.plot(x, y_ shanghai, label=" 上海")
# plt.plot(x, y_ beijing, color="r", linestyle="--", label="北京")
axes [0].plot(x, y_shanghai, label=" 上海")
axes[1].plot(x, y_beijing, color="r", linestyle="--", label="北京")
# 2.1添加x,y轴刻度
#构造x,y轴刻度标签
x_ticks_label = ["11点{}分" . format(i) for i in x]
y_ticks = range(40)
#刻度显示
# plt.xticks(x[::5], x_ ticks_ label[::5])
# plt.yticks(y_ ticks[::5])
axes[0].set_xticks(x[::5])
axes[0].set_yticks(y_ticks[::5])
axes[0].set_xticklabels(x_ticks_label[::5])
axes[1].set_xticks(x[::5])
axes[1].set_yticks(y_ticks[::5])
axes [1].set_xticklabels(x_ticks_label[::5])
# 2.2添加网格显示
# plt.grid(True, linestyle="--", alpha=0.5)
axes [0]. grid(True, linestyle="--", alpha=0.5)
axes [1]. grid(True, linestyle="--", alpha=0.5)
# 2.3添加描述信息
# plt.xlabel("时间")
# plt.ylabel("温度")
# plt.title("中午11点--12点某城市温度变化图", fontsize=20)
axes [0].set_xlabel("时间")
axes [0].set_ylabel("温度")
axes[0].set_title("中午11点--12点某城市温度变化图",fontsize=20)
axes[1].set_xlabel("时间" )
axes[1].set_ylabel("温度" )
axes [1].set_title("中午11点--12点某城市温度变化图",fontsize=20)
# #2.4图像保存
# plt. savefig("./test. png")
# #2.5添加图例
# plt. legend(loc=0)
axes [0]. legend(loc=0)
axes [1]. legend(loc=0)
# 3.图像显示
plt. show()
画图结果
数学函数绘图
导入包:
import matplotlib.pyplot as plt
import numpy as np
画图代码:
# 0.准备数据
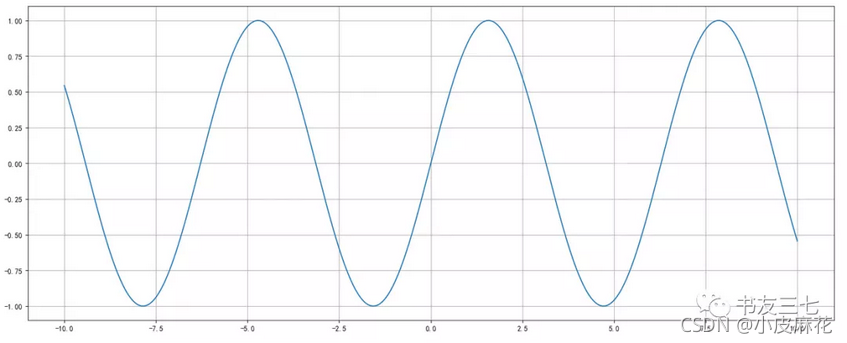
x = np.linspace(-10,10,1000) #生成-10到10的1000个数
y = np.sin(x)
# 1.创建画布
plt.figure(figsize = (20,8),dpi = 100)
# 2.绘制函数图像
plt.plot(x,y)
# 2.1添加网格
plt.grid()
# 3.显示图像
plt.show()
画图结果:
画图小结:
·添加x,y轴刻度
plt.xticks()
plt.yticks()
注意:在传递进去的第一个参数必须是数字不能是字符串,如果是字符,需要进行替换操作
添加网格显示
plt.grid(inestyle="--" ,alpha=0.5)
·添加描述信息
plt.xlabel()
plt.ylabel()
plt.title()
·图像保存
plt.savefig("路径")
显示图例
plt.legend(loc="best")
注意:一定要在plt.plot()里面设置-个label,如果不设置,没法显示
·多个坐标系显示
plt.subplots(nrows=, ncols=)