源文档链接:HIDE: Hydrogen (HI) Data Emulator 0.1.0 documentation![]() https://hide.readthedocs.io/en/latest/index.html#HIDE软件包是由苏黎世联邦理工学院天文学研究所宇宙学研究小组的软件实验室开发的。
https://hide.readthedocs.io/en/latest/index.html#HIDE软件包是由苏黎世联邦理工学院天文学研究所宇宙学研究小组的软件实验室开发的。
宇宙学研究小组的软件实验室 Software Lab of the Cosmology Research Group![]() http://www.cosmology.ethz.ch/research/software-lab.html 苏黎世联邦理工学院天文学研究所 ETH Institute of Astronomy
http://www.cosmology.ethz.ch/research/software-lab.html 苏黎世联邦理工学院天文学研究所 ETH Institute of Astronomy![]() http://www.astro.ethz.ch/.
http://www.astro.ethz.ch/.
The development is coordinated on GitHub and contributions are welcome. The documentation of HIDE is available at readthedocs.org .
目录
HIDE: Hydrogen (HI) Data Emulator
HIDE: Hydrogen (HI) Data Emulator

HIDE is a package for simulating of a single dish radio telescope survey. As such, it takes healpix maps as inputs and processes them into TOD. The design is flexible and can be customized to different instruments and survey designs.
HIDE 是一个用于模拟单碟射电望远镜调查的软件包。因此,它将 healpix 映射作为输入并将它们处理到 TOD 中。设计灵活,可根据不同的仪器和测量设计进行定制。
Installation
The project is hosted on GitHub. Get a copy by running:
该项目位于 GitHub 上。通过运行获得一个副本:
$ git clone https://github.com/cosmo-ethz/hide.gitInstall the package like this:
像这样安装包:
$ cd hide
$ pip install -r requirements.txt
$ python setup.py install --user
Alternatively, if you want to develop new features:
或者,如果你想开发新功能:
$ cd hide
$ python setup.py develop --user
Usage
To use Hydrogen (HI) Data Emulator in a project execute the following on the command line:
要在项目中使用 Hydrogen (HI) 数据模拟器,请在命令行中执行以下命令:
$ hide --strategy-start=2016-03-21-00:00:00 --strategy-end=2016-03-21-23:59:00 --verbose=True hide.config.bleien7mThis will simulate one day of time-ordered-data from the Bleien 7m radio telescope.
这将模拟 Bleien 7m 射电望远镜一天的时间顺序数据。
To visualize 15 minutes of the generated data run this:
要可视化生成的15分钟数据,请运行以下命令:
import matplotlib.pyplot as plt
import matplotlib
import h5py

with h5py.File("./2016/03/21/TEST_MP_PXX_20160321_000000.h5", "r") as fp:
    tod = fp["P/Phase1"].value
    time = fp["TIME"].value

plt.imshow(tod, aspect="auto",
           extent=(time[0], time[-1],990, 1260),
           cmap="gist_earth", norm=matplotlib.colors.LogNorm())
plt.colorbar()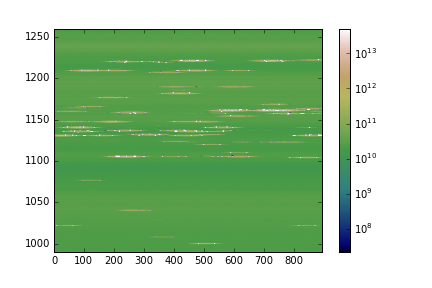
hide Package
Subpackages
- astro Package
- beam Package
- config Package
- earth Package
- plugins Package
- add_background Module
- add_point_sources Module
- add_reference Module
- add_rfi Module
- add_rfi_phaseswitch Module
- apply_gain Module
- astro_signal Module
- background_noise Module
- clean_up Module
- combine_signals Module
- coord_transform Module
- earth_signal Module
- initialize Module
- load_beam_profile Module
- map_frequency_plugin Module
- map_strategy_plugin Module
- qu_opt_coord_transform Module
- reduce_frequency_plugin Module
- reduce_signals_plugin Module
- scanning_strategy Module
- write_calibration Module
- write_coords Module
- write_rfi Module
- write_tod Module
- write_tod_fits Module
- write_tod_phaseswitch Module
- spectrometer Package
- strategy Package
- utils Package
Tips
To run a subset of tests:
运行测试的子集:
$ py.test test/test_hide.py