1 Graphviz制图概述
总的来说,Graphviz 支持两类图:
- 无向图(graph,用“ - - ”表示节点之间)
- 有向图(digraph,用“ ->” 表示节点之间)。
顶点和边都具有各自的属性,比如形状,颜色,填充模式,字体,样式等。主要的布局器如下:
- dot: 默认布局方式,主要用于有向图;
- neato:基于 sprint model 模型,又称force-based 或者 energy minimized;
- twopi:径向布局,放射状;
- circo:圆环布局;
- fdp:无向图;
- dotty:一个用于可视化与修改图形的图形用户界面程序;
- lefty:一个可以显示 DOT 图形的可编程控件,并允许用户用鼠标在图上执行操作。
2 如果存在*.DOT文件,如何生成图的命令
dot -T jpg ./grph.dot -o graph01.jpg 或
dot -T png ./grph.dot -o graph01.png
3 *.DOT文件中,关于dot的语法
1 )简单语法和图形,

2)带标签的语法结构

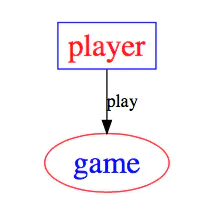
3)色彩丰富的图
digraph {

    player[label = "player", color = Blue, fontcolor = Red, fontsize = 24, shape = box];
    game[label = "game", color = Red, fontcolor = Blue, fontsize = 24, shape = ellipse];

    player -> game[label = "play"]
}
4 在节点插入图片
digraph {

    c[shape = none, image = "./D06.png"]
    a -> b -> c;
    c -> d;
}
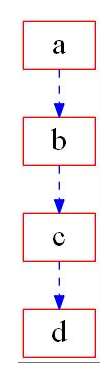
5 在节点插入图片
节点和连线的统一定义(先进行node、edge的统一定义,在定义数据的节点):
digraph {

    node[color = Red, fontsize = 24, shape = box]
    edge[color = Blue, style = "dashed"]

    c[shape = none, image = "./pic.png"]
    a -> b -> c;
    c -> d;
}
6 在一个图中,嵌入子图
digraph {
    label = visitNet
    rankdir = LR
    node[color = Red, fontsize = 24, shape = box]
    edge[color = Blue, style = "dashed"]

    user[style = "filled", color = "yellow", fillcolor = "chartreuse"]
    subgraph cluster_cd{
        label = "server and browser"
        bgcolor = green;
        browser -> server
    }
    user -> computer;
    computer -> browser;
} 
7 结构视图
注意点
1 用节点定义node[shape = record];定义节点是结构
2 用label=“字符串” 定义结构的内容,用“|”分割开
3 用<结构项标号>标明结构的单项标号
3 用 结构体:单项标号->结构体:单项标号 表明关系连线
digraph {
node[shape = record];
struct1[label = "<f0> left|<f1> mid\ dle|<f2> right"];
struct2[label = "<f0> one|<f1> two"];
struct3[label = "hello\nworld | {b|{c|<here> d|e}|f}|g|h"];
struct1:f1 -> struct2:f0;
struct1:f2 -> struct3:here;
}
8 树形结构
digraph tree {

  fontname = "PingFang-SC-Light"
  fontsize = 24

  node[shape = "plaintext"]

  1 -> 2;
  1 -> 3;
  2 -> 4;
  2 -> 5;
  3 -> 6;
  3 -> 7;
  4 -> 8;
  4 -> 9;
  5 -> 10;
  5 -> 11;
  6 -> 12;
  6 -> 13;
  7 -> 14;
  7 -> 15;
}
9 继承关系
digraph UML {

    node[fontname = "Courier New", fontsize = 10, shape = record];
    edge[fontname = "Courier New", fontsize = 10, arrowhead = "empty"];

    Car[label = "{Car | v : float\nt : float | run() : float}"]

    subgraph clusterSome{
        bgcolor = "yellow";
        Bus[label = "{Bus | | carryPeople() : void}"];
        Bike[label = "{bike | | ride() : void}"];
    }

    Bus -> Car
    Bike -> Car

}
10 时序关系图
digraph time {

    rankdir = "LR";
    node[shape = "point", width = 0, height = 0];
    edge[arrowhead = "none", style = "dashed"];

    {
        rank = "same"
        edge[style = "solided"];
        APP[shape = "plaintext"];
        APP -> step00 -> step01 -> step02 -> step03 -> step04 -> step05;
    }

    {
        rank="same";
        edge[style="solided"];
        SDK[shape="plaintext"];
        SDK -> step10 -> step11 -> step12 -> step13 -> step14 -> step15;
    }
    {
        rank="same";
        edge[style="solided"];
        AliPay[shape="plaintext"];
        AliPay -> step20 -> step21 -> step22 -> step23 -> step24 -> step25;
    }
    {
        rank="same";
        edge[style="solided"];
        Server[shape="plaintext"];
        Server -> step30 -> step31 -> step32 -> step33 -> step34 -> step35;
    }

    step00 -> step10 [label="sends order info", arrowhead="normal"];
    step11 -> step21 [label="open AliPay", arrowhead="normal"];
    step22 -> step12 [label="pay success", arrowhead="normal"];
    step13 -> step03 [label="pay success", arrowhead="normal"];
    step24 -> step34 [label="pay success", arrowhead="normal"];
}
参考文章:
- 关于语法:GraphViz Examples and Tutorial (grevian.org)
- GraphViz的其它用途:GraphViz的使用 - 简书 (jianshu.com)
- 使用Graphviz和DOT语言绘图-百度经验 (baidu.com)
- Graphviz 的中文文档,Graphviz 中文文档
- Dot 语言介绍(想要更多了解的时候可以查看),Graphviz Dot 语言介绍
- Python Graphviz 的入门文档,Graphviz User Guide
- Python Graphviz 的 Example 介绍,Graphviz 的例子
- Graphviz 的下载,Graphviz Download
- 使用 Graphviz 的例子,生成项目UML框架图-pyreverse介绍
- GraphViz Examples and Tutorial (grevian.org)