Matlab里做多给轴的函数很直接,双轴是plotyy, 三轴是plotyyy, 四轴是plot4y,更多应该是multiplotyyy。
而matplotlib似乎可以用figure.add_axes()来实现,探索中……
试验过程中发现一隐藏功能
jupyter notebook 码如下:
%matplotlib inline

import numpy as np
import matplotlib.pyplot as plt

fig = plt.figure()

t = np.arange(0.0, 1.0, 0.01)
s = np.sin(2 * np.pi * t)
c = np.cos(2 * np.pi * t)

ax1 = fig.add_axes([0, 0, 0.8, 0.5])
line1, = ax1.plot(t, s, color='blue', lw=2)
ax2 = fig.add_axes([0, 0, 0.8, 0.5])
line2, = ax2.plot(t, c, color='blue', lw=2)

plt.show()
执行后跳出一提醒:
X:\anaconda3\lib\site-packages\matplotlib\cbook\deprecation.py:106: MatplotlibDeprecationWarning: Adding an axes using the same arguments as a previous axes currently reuses the earlier instance.  In a future version, a new instance will always be created and returned.  Meanwhile, this warning can be suppressed, and the future behavior ensured, by passing a unique label to each axes instance.
  warnings.warn(message, mplDeprecation, stacklevel=1)
图的效果是
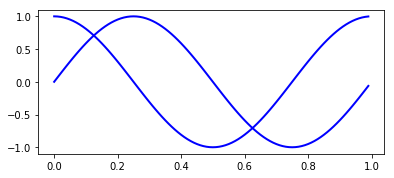
因为参数一样,把两图给合并显示了,如果 ax2 = fig.add_axes([0, 0, 0.8, 0.5])中的l,b,w,h有一个不一样,后定义的直接遮盖前面定义,或加上去的axes