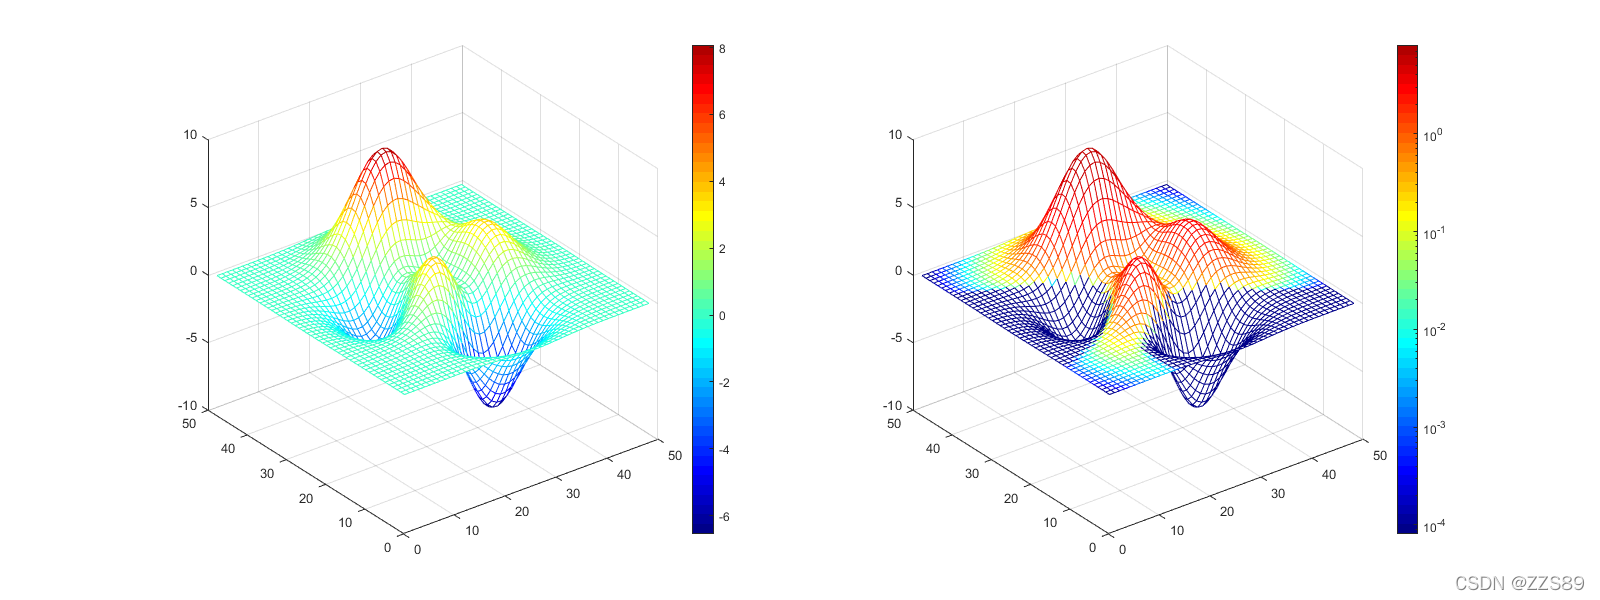
用于设置色标表示形式,colorscale有两种表现形式,‘Linear’ or ‘log’.
clear;close;
colormap(jet(50));
h = figure(1);set(h,'position',[10 10 1600 600])
subplot 121
mesh(peaks);colorbar;axis
subplot 122
mesh(peaks);colorbar;axis  auto
set(gca,'ColorScale','log')
用于设置色标表示形式,colorscale有两种表现形式,‘Linear’ or ‘log’.
clear;close;
colormap(jet(50));
h = figure(1);set(h,'position',[10 10 1600 600])
subplot 121
mesh(peaks);colorbar;axis
subplot 122
mesh(peaks);colorbar;axis auto
set(gca,'ColorScale','log')