调试之前,项目文件夹中需要运行命令:
go mod init my-app-name
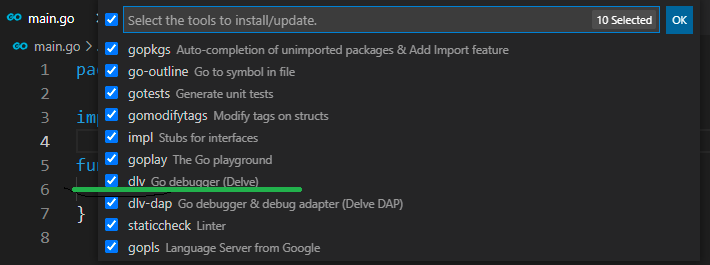
go debugger tool dlv,在配置 vscode go 开发环境时就可以安装:
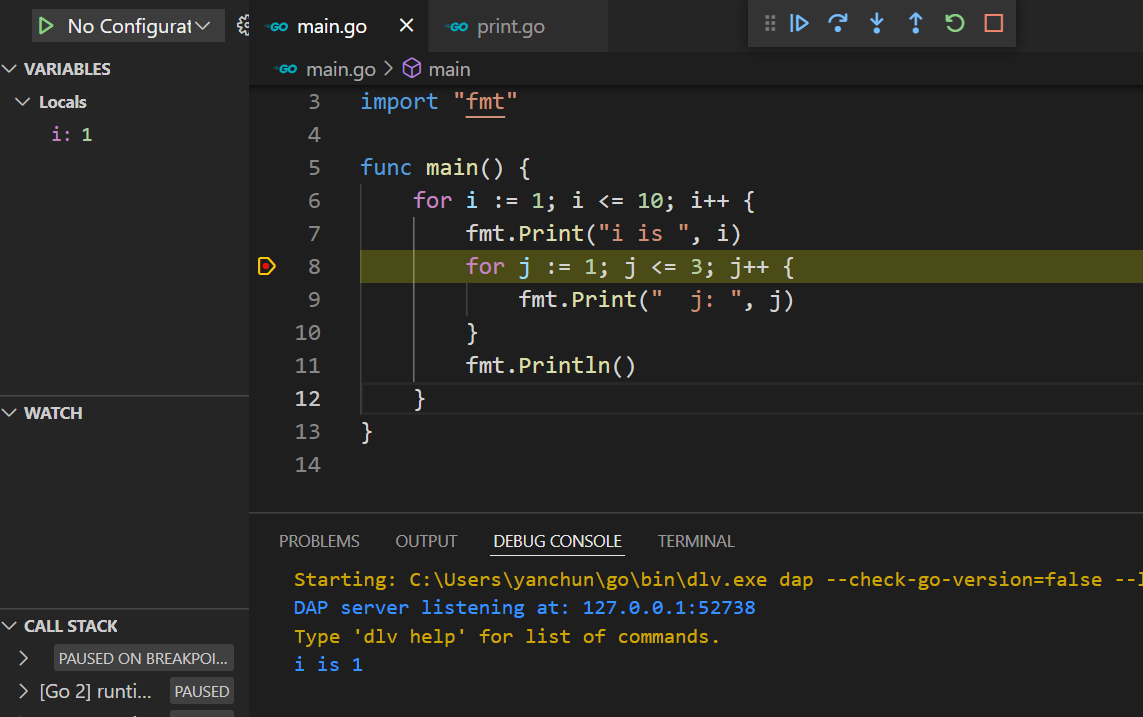
然后 go code 中可以设 breakpoint,选择 vscode -> run -> start debugging,就可以开始调试代码,例如 step over, continue, 等等,这和其他语言比方说 C++ 的调试方法几乎完全一样。
如果要调试会从键盘读取输入的app,在工程中新增一个名称为.vscode 的文件夹,包含两个文件:
tasks.json
{


    // See https://go.microsoft.com/fwlink/?LinkId=733558
    // for the documentation about the tasks.json format
    "version": "2.0.0",
    "tasks": [
        {


            "label": "delve",
            "type": "shell",
            "command": "dlv debug --headless --listen=:23456 --api-version=2 \"${workspaceFolder}\"",
            "isBackground": true,
            "presentation": {


                "focus": true,
                "panel": "dedicated",
                "clear": false
            },
            "group": {


                "kind": "build",
                "isDefault": true
            },
            "problemMatcher": {


                "pattern": {


                    "regexp": ""
                },
                "background": {


                    "activeOnStart": true,
                    "beginsPattern": {


                        "regexp": ".*"
                    },
                    "endsPattern": {


                        "regexp": ".*server listening.*"
                    }
                }
            }
        }
    ]
}
launch.json
{


    // Use IntelliSense to learn about possible attributes.
    // Hover to view descriptions of existing attributes.
    // For more information, visit: https://go.microsoft.com/fwlink/?linkid=830387
    "version": "0.2.0",
    "configurations": [
        {


            "name": "Connect to server",
            "type": "go",
            "request": "attach",
            "preLaunchTask": "delve",
            "mode": "remote",
            "remotePath": "${workspaceFolder}",
            "port": 23456,
            "host": "127.0.0.1",
            "cwd": "${workspaceFolder}"
        }
    ]
}
然后重启 vscode 开始调试,输出不再出现在 debug console, 而是出现在 terminal window。