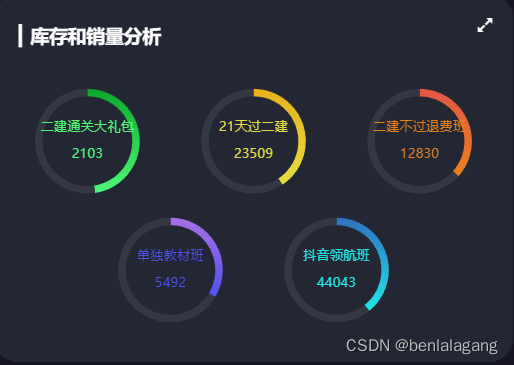
最终效果如图
组件结构设计
外部Stockpage.vue
显示最外侧组件的结构
<template>
  <div class="comP1">
    <Stock></Stock>
  </div>
</template>

<script>
  import Stock from "@/components/Stock";
  export default {
    name: "StockPage",
    components:{Stock}
  }
</script>

<style scoped>

</style>
内部的Stock
<!-- 显示库存的环形图表 -->
<template>
<div class="comP2" ref="stock_1"></div>
</template>
<script>
export default {
data () {
return {}
},
methods: {}
}
</script>
<style lang="less" scoped>
</style>
初始化图表+数据的获取+更新图表+定时器切换的启停
组件挂载到DOM时 初始化图表 =》 获取数据 =》更新图表 =》 增加分辨率适配
组件被卸载时:清除定时器 清除分辨率变化的响应
    mounted() {
      // 渲染DOM元素之后 初始化图表实例 请求数据 监听页面尺寸变化
      this.initChart()
      this.getData()
      window.addEventListener('resize',this.screenAdapter)
      this.screenAdapter()
    },
    destroyed() {
      clearInterval(this.timerID)
      window.removeEventListener('resize',this.screenAdapter)
    },
初始化图表:
基本零配置 就添加个标题 对图表实例添加鼠标移入移出 定时器 启停的效果
      initChart(){
        this.chartsInstance = this.$echarts.init(this.$refs.stock_1,this.theme)
        const initOption = {
          title:{
            text:'▎库存和销量分析',
            left:20,
            top:30
          },
        }
        this.chartsInstance.setOption(initOption)
        this.chartsInstance.on('mouseover',()=>{
          clearInterval(this.timerID)
        })
        this.chartsInstance.on('mouseout',()=>{
          this.startInterval()
        })
      },
获取数据
get 到数据 调用更新图表的方法 启动定时器
 getData(){
  const {data:res} = await this.$http.get('stock')
  this.allData = res
  this.updateChart()
  this.startInterval()
},
获取到的数据:
[{
    "name": "二建通关大礼包",
    "stock": 2310,
    "sales": 2103
}, {
    "name": "21天过二建",
    "stock": 34312,
    "sales": 23509
}, {
    "name": "二建不过退费班",
    "stock": 22140,
    "sales": 12830
}, {
    "name": "单独教材班",
    "stock": 10842,
    "sales": 5492
}, {
    "name": "抖音领航班",
    "stock": 68102,
    "sales": 44043
}, {
    "name": "二建押题班",
    "stock": 12032,
    "sales": 8603
}, {
    "name": "一建智学班",
    "stock": 9890,
    "sales": 8960
}, {
    "name": "28天过一建",
    "stock": 20130,
    "sales": 12302
}, {
    "name": "一建精学班",
    "stock": 89342,
    "sales": 42948
}, {
    "name": "1V1督学班",
    "stock": 5034,
    "sales": 1220
}]
数据更新图表
对获取到的数据进行操作 得到想要的 设置到配置项 更新图表
使用到的数据
data(){
  return{
    chartsInstance:null, // 组件实例
    allData:null, // 请求过来处理过后的数据
    currentIndex:0, // 根据这个改变显示数列
    timerID:null // 定时器
  }
},
- 定义两个数组 一个是中心点(基于x轴偏移多少,基于y) 一个是渐变色的数组
- 根据现有的 currentIndex *5 取出要展示的数据 map操作出对应的系列 系列就是五个饼图(圆环图) item.sales 用渐变色 item.stock用灰底色
      updateChart(){
        const centerArr = [
          ['18%','40%'],
          ['50%','40%'],
          ['82%','40%'],
          ['34%','75%'],
          ['66%','75%']
        ]
        const colorArr = [
          ['#4ff778','#0ba82c'],
          ['#e5dd45','#e8b11c'],
          ['#e8821c','#e55445'],
          ['#5052ee','#ab6ee5'],
          ['#23e5e5','#2e72bf'],
        ]
        const start = this.currentIndex * 5
        const end =  (this.currentIndex + 1) * 5
        const showData = this.allData.slice(start,end)
        const seriesArr = showData.map((item,index) => {
          return {
            type:'pie',
            center:centerArr[index],
            hoverAnimation:false, // 关闭鼠标移入饼图时的动画效果
            labelLine:{
              show:false // 隐藏指示线
            },
            label:{
              position:'center',
              color:colorArr[index][0]
            },
            data:[
              {
                name:item.name + '\n' + '\n' + item.sales,
                value:item.sales,
                itemStyle:{
                  color: new this.$echarts.graphic.LinearGradient(0,1,0,0,[
                    {
                      offset:0,
                      color:colorArr[index][0]
                    },
                    {
                      offset:1,
                      color:colorArr[index][1]
                    }
                  ])
                }
              },
              {
                value:item.stock,
                itemStyle:{
                  color:'#333843'
                }
              }
            ]
          }
        })
        const dataOption = {
          series:seriesArr
        }
        this.chartsInstance.setOption(dataOption)
      },
定时器的回调
0-1 之间切换 因为总数居10条 一次展示5条
      startInterval(){
        if (this.timerID){
          clearInterval(this.timerID)
        }
        this.timerID = setInterval(()=>{
          this.currentIndex++
          if (this.currentIndex > 1){
            this.currentIndex = 0
          }
          this.updateChart()
        },4400)
      },
屏幕尺寸变化的响应
圆环的半径在这里相应的设置
      screenAdapter(){
        // 标题 文字 圆环
        const titleFontSize = this.$refs.stock_1.offsetWidth / 100 * 3.6
        const innerRadius = titleFontSize * 2.8
        const outRadius = titleFontSize * 2.4
        const seriesArr = []
        for (let i=0;i<5;i++){
          seriesArr.push({
            type:'pie',
            radius:[outRadius,innerRadius],
            label: {
              fontSize: titleFontSize / 1.4
            }
          })
        }
        const adapterOption = {
          title:{
            textStyle:{
              fontSize: titleFontSize
            }
          },
          series: seriesArr
        }
        this.chartsInstance.setOption(adapterOption)
        this.chartsInstance.resize()
      }