Blender进阶Python编程3D开发-源码分析笔记系列-做出你自己的3D数据图表
忽然想起之前研究Blender时,用Python编程做了个3D图表。当时还觉得只是炫酷而已,现在用处来了~
你有没有在写文章时感觉:
- 在Markdown做表格太枯燥?
- 不能像用Jupyter Notebook时,直接用matplotlib,而只能插入图表图片?
- 感觉做得再炫酷也只是2D平平的?
同感三连的话,我们走起试一下用Blender的Python编辑功能,做一个3D数据图表~
注:前置基础
- 3D软件设计的日常(Blender无Python编辑的各种操作及热键)
- 基本Python编程技能
- 编程环境,比如VScode及常用技巧
BTW,可以把Blender的Scripting模式(文尾有附图)里,代码窗口的代码们,复制到VSCode内,就能解锁以下几个 姿势 \xcancel{姿势} 姿势 大招:
- 快捷键Alt+Shift+↓键:复制当前行
- Alt+Z:自动换行
案例源码及分析
先放效果
代码直击
import bpy
#import csv

filepath=r'C:\<your path>\BlenderProject\BlenderPython\data\04\tutorial.txt'

data=dict()

with open(filepath, 'r') as txt_file:
    for idx,line in enumerate(txt_file.readlines()):
        if idx>0:
            line=line.rstrip('\n')
            day=line.split(',')[0]
            hours_worked=line.split(',')[1]

            data[idx]={


                'lable':day,
#               'hours_worked':hours_worked
                'value':hours_worked
            }
#Cleanup scene
for obj in bpy.data.objects:
    bpy.data.objects.remove(obj)

#Visualize data
for idx, data_entry in enumerate(data):
#    print(data[data_entry])
    #Create a bar
    height=float(data[data_entry]['value'])
#    label=data[data_entry]['lable']
#    print(label)
#    print(value)
    bpy.ops.mesh.primitive_cube_add(size=1, location=(0, idx, 0))
    bpy.ops.transform.resize(value=(1, 1, height), orient_type='GLOBAL', orient_matrix=((1, 0, 0), (0, 1, 0), (0, 0, 1)), orient_matrix_type='GLOBAL', constraint_axis=(False, False, True), mirror=False, use_proportional_edit=False, proportional_edit_falloff='SMOOTH', proportional_size=1, use_proportional_connected=False, use_proportional_projected=False)

    bpy.ops.transform.translate(value=(0, 0, height/2), orient_axis_ortho='X', orient_type='GLOBAL', orient_matrix=((1, 0, 0), (0, 1, 0), (0, 0, 1)), orient_matrix_type='GLOBAL', constraint_axis=(False, False, True), mirror=False, use_proportional_edit=False, proportional_edit_falloff='SMOOTH', proportional_size=1, use_proportional_connected=False, use_proportional_projected=False)

    #Label the bar
    label=data[data_entry]['lable']
    bpy.ops.object.text_add(enter_editmode=True,location=(0.6,idx-0.5, 0))
    bpy.ops.font.delete(type='PREVIOUS_WORD')
    bpy.ops.font.text_insert(text=label)
    bpy.ops.object.editmode_toggle()


#    reader=csv.reader(csv_file)
#
##    for row in readers:
##        data[row[0]]=row[1]
##
#    for idx, row in enumerate(reader):
#        data[idx]={


#            'lable':row[0],
#            'value':row[1],
#            }
#print(data)
改写案例
操作思路
先得有个数据来源,比如:全国历年考研人数;
然后:
- 改写表格内容(这里是.txt文件)
- 相关代码改写与 调教 \bcancel{调教} 调教 调试
- 生成/渲染效果
代码直击
import bpy
#import csv


#filepath=r'C:\<your path>\BlenderProject\BlenderPython\data\04\tutorial.txt'
filepath=r'C:\PC2013_Code\BlenderProject\BlenderPython\data\04\pee_num.txt'
data=dict()

with open(filepath, 'r') as txt_file:
    for idx,line in enumerate(txt_file.readlines()):
        if idx>0:
            line=line.rstrip('\n')
            #day=line.split(',')[0]
            Year=line.split(',')[0]
            #hours_worked=line.split(',')[1]
            num10k=line.split(',')[1]

            data[idx]={


                #'lable':day,
                'lable':Year,
#               'hours_worked':hours_worked
                #'value':hours_worked
                'value':num10k
            }
#Cleanup scene
for obj in bpy.data.objects:
    bpy.data.objects.remove(obj)

#Visualize data
for idx, data_entry in enumerate(data):
#    print(data[data_entry])
    #Create a bar
    height=float(data[data_entry]['value'])
#    label=data[data_entry]['lable']
#    print(label)
#    print(value)
    bpy.ops.mesh.primitive_cube_add(size=1, location=(0, idx, 0))
    bpy.ops.transform.resize(value=(1, 1, height), orient_type='GLOBAL', orient_matrix=((1, 0, 0), (0, 1, 0), (0, 0, 1)), orient_matrix_type='GLOBAL', constraint_axis=(False, False, True), mirror=False, use_proportional_edit=False, proportional_edit_falloff='SMOOTH', proportional_size=1, use_proportional_connected=False, use_proportional_projected=False)

    bpy.ops.transform.translate(value=(0, 0, height/2), orient_axis_ortho='X', orient_type='GLOBAL', orient_matrix=((1, 0, 0), (0, 1, 0), (0, 0, 1)), orient_matrix_type='GLOBAL', constraint_axis=(False, False, True), mirror=False, use_proportional_edit=False, proportional_edit_falloff='SMOOTH', proportional_size=1, use_proportional_connected=False, use_proportional_projected=False)

    #Label the bar
    label=data[data_entry]['lable']
    bpy.ops.object.text_add(enter_editmode=True,location=(0.6,idx-0.5, 0))
    bpy.ops.font.delete(type='PREVIOUS_WORD')
    bpy.ops.font.text_insert(text=label)
    bpy.ops.object.editmode_toggle()


#    reader=csv.reader(csv_file)
#
##    for row in readers:
##        data[row[0]]=row[1]
##
#    for idx, row in enumerate(reader):
#        data[idx]={


#            'lable':row[0],
#            'value':row[1],
#            }
#print(data)
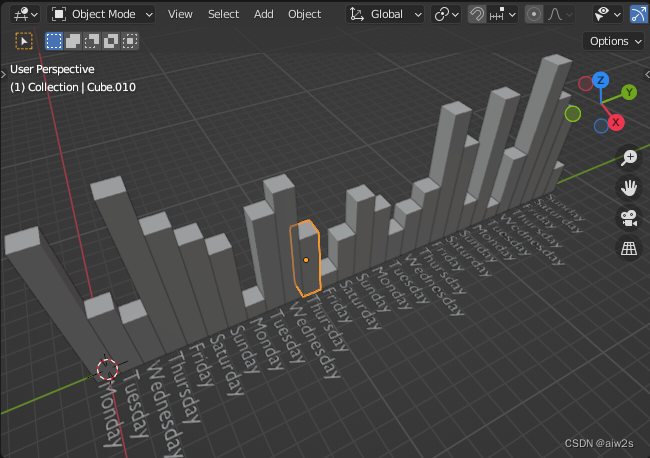
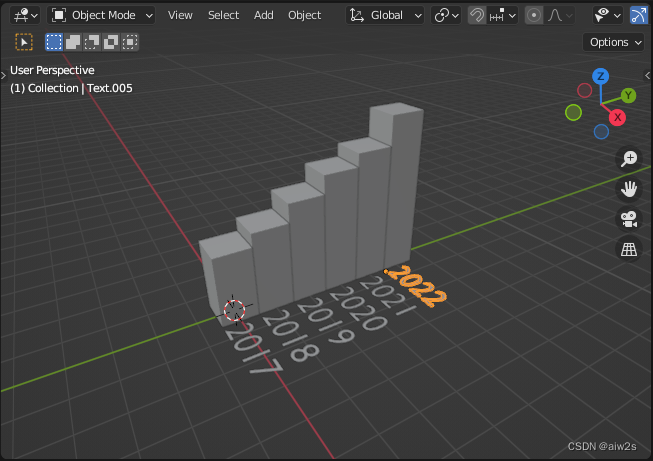
效果展示
你不对劲…
敬仰之视角:
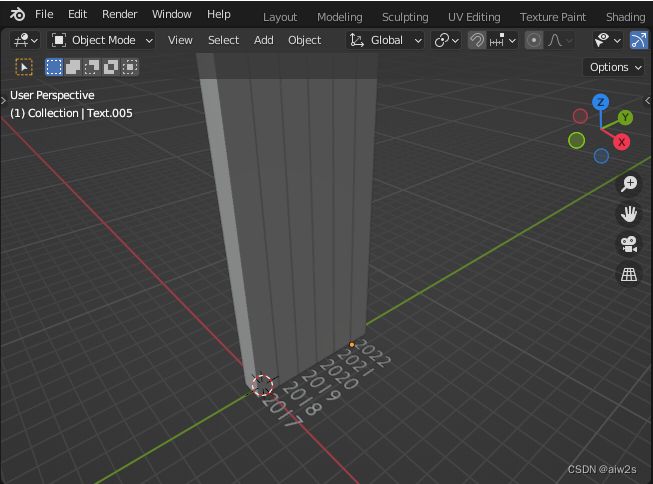
意识到问题所在:人家原先都是个位数,我这里的都是好几百~
篇幅关系(其实没有),直接给出位置截图:
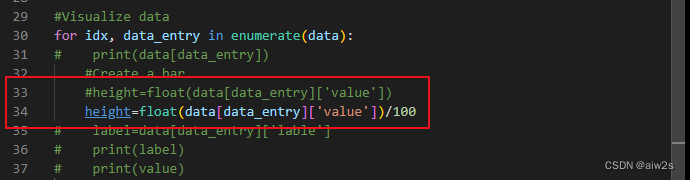
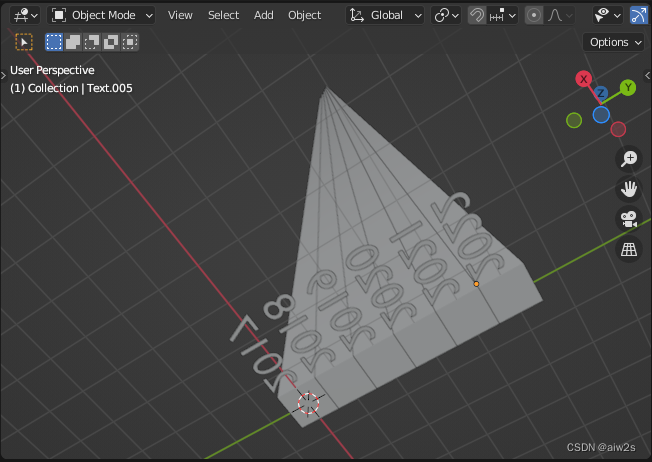
贴心给出代码,方便复制粘贴:
    #height=float(data[data_entry]['value'])
    height=float(data[data_entry]['value'])/100
正常些了(怎么感觉又有些矮月半)…
好吧,先到这里,还需要进一步调试,比如:
- 纵轴的数据
- 厚度削薄些
- 标题与上色
做好后拿到3D数据图表的图片(虽然还是平平的…),继续 肝 \cancel{肝} 肝 赶其它稿子去了~
参考资料
暂时找不到了【建设中】
附图
Blender的Scripting窗口酱紫:
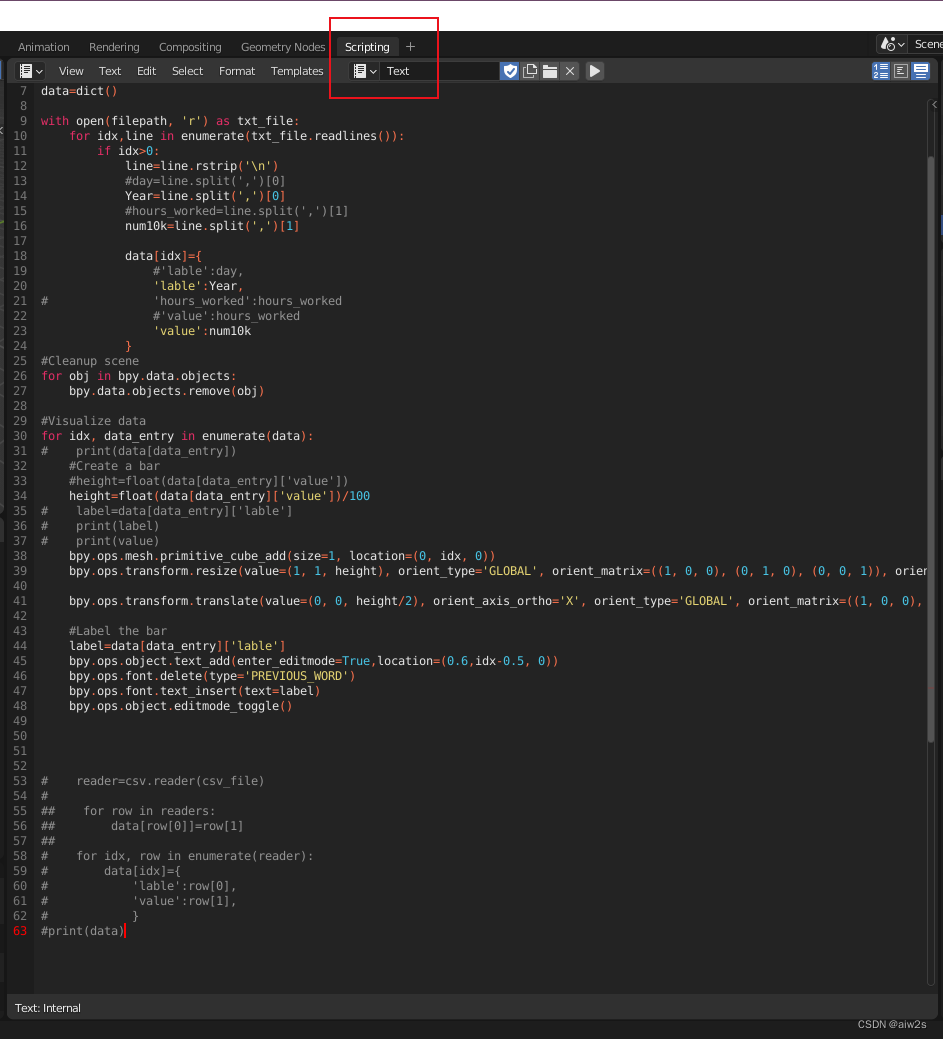
VSCode的窗口,鲜艳而舒适多了~