Echarts绘制图表基本步骤
1、全局安装Echarts
2、封装公共组件并初始化实例
3、设置图表配置项Option
4、组装图表数据
5、最终效果
一、全局安装Echarts
npm install echarts --save
main.js中
import echarts from 'echarts'
Vue.prototype.$echarts = echarts
二、封装公共组件并初始化实例
<echart-statis :option="echartOption" ></echart-statis>
初始化实例:
echartStatis.vue中
<template>
  <div ref="myChart" :style="{width:width,height:height}"></div>
</template>
 mounted() {


   this.initChart();
  },
  beforeDestroy() {


    // 移除窗口改变监听
    window.removeEventListener('resize', this.myChart._resize)
  },
  methods:{


    initChart() {


      this.myChart = this.$echarts.init(this.$refs.myChart);
      // 指定图表的配置项和数据
      this.myChart.setOption(this.option);
      // 添加窗口改变监听
      this.myChart._resize = () => {


        this.myChart.resize()
      }
      window.addEventListener('resize',  this.myChart._resize)
    },
  }
三、设置图表配置项Option
配置项Option在父组件中组装加工
let echartOption= {


	title: {


		//text为主标题  位置默认左上
		//subtext为副标题   根据需要自定义使用
		//textStyle: {} 主标题样式设置,可自定义字体,颜色
        //subtextStyle: {}副标题样式设置
        //color:['#04BE02', '#409eff', '#e6a23c', '#EF7C57', '#F44260','#3376FF'],色板颜色
       text: '第一个 ECharts 实例'
    },
    //配置提示信息
    tooltip: {

    },
    //图例组件展现了不同系列的标记(symbol),颜色和名字。可以通过点击图例控制哪些系列不显示。
    legend: {


         data: ["苹果","谷歌","微软","腾讯","阿里","总计"],
          //data: [{可单独设置每个标记的属性样式
	      // name: '系列1',
	      // 强制设置图形为圆。
	      //icon: 'circle',
	      // 设置文本为红色
	      //textStyle: {


	      //  color: 'red'
	     // }
	    //}]
    },
    //配置要在 X 轴显示的项:可通过后端接口请求获取
    xAxis: {


        data: []
    },
    //配置要在Y 轴显示的项:可通过后端接口请求获取
    yAxis: {


     type: "value",//y轴顶部展示当前数据
    },
    //系列列表
	//每个系列通过 type 决定自己的图表类型:
    series: [{


      name: '苹果',
      type: 'bar',//bar柱状/条形图,line折线/面积图,pie饼图
      data: [],//可通过接口获取
      stack: "total",
      symbolSize: 10,
      symbol: "circle",
      //柱状图堆叠设置
      itemStyle: {


        normal: {


          color: "#04BE02",
          barBorderRadius: 0,
          label: {


            show: true,
            position: "top",
            formatter(p) {


              return p.value > 0 ? p.value : "";
            },
          },
        },
      },
      ... //中间类型参考第一个写法
      //总计用折线图显示
     {


        name: "总计",
        type: "line",
        stack: "all",
        symbolSize: 10,
        symbol: "circle",
        itemStyle: {


          normal: {


            color: "#3376FF",
            barBorderRadius: 0,
            label: {


              show: true,
              position: "top",
              formatter(p) {


                return p.value > 0 ? p.value : "";
              },
            },
          },
        },
        data: [],
      },
  }]
};
四、组装图表数据
getChartData() {


   getChartData().then(response => {


     if (response.status == 200) {


       let res = response.data;
       if (res.code == 0) {


         let stat= res.data.stat;
         for(let i in stat.yData){


        	 this.echartOption.series[i].data = stat.yData[i];
         }
         this.echartOption.xAxis.data = stat.xData;
       } else {


         this.$message({


           message: res.msg,
           type: "warning",
         });
       }
     } else {


       this.$message({


         message: "服务器维护中",
         type: "error",
       });
     }
   })
 },
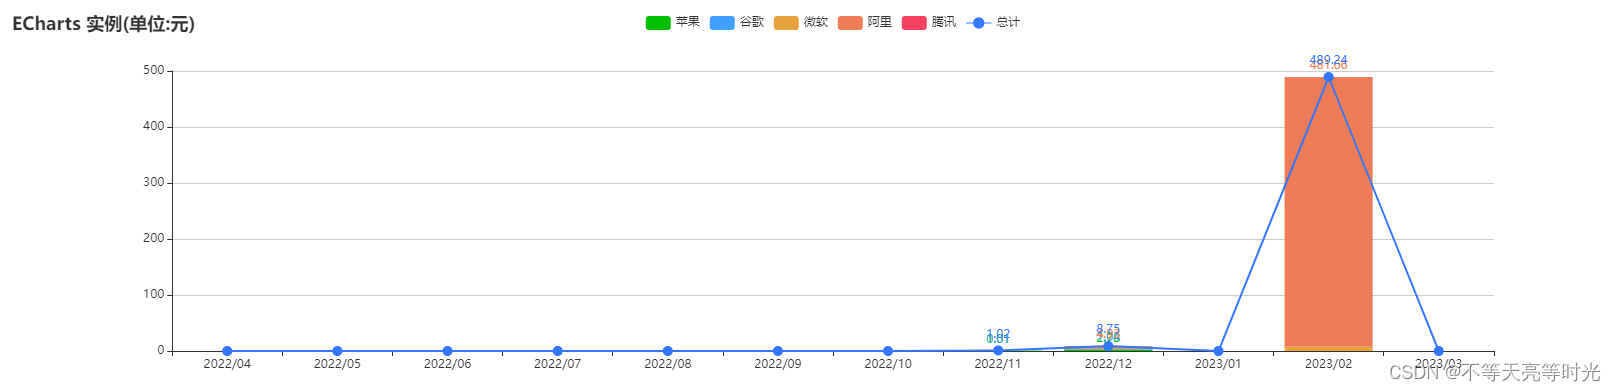
五、最终效果