实验目的:
1.掌握利用MATLAB输入声纳图像
2.用MATLAB实现声纳图像的傅里叶变换
3. 得到声纳图像傅里叶变换后的幅度谱和相位谱
4. 将声纳图像的幅度谱和相位谱进行双谱反变换
5. 利用子图形式实现原始声纳图像、幅度谱、相位谱和反变换重构后声纳图像的显示。
实验要求:绘制三维散点图,并实现上述功能。
源代码如下:
I=imread("声纳图像.bmp");
I_grey=rgb2gray(I);
subplot(2,2,1);imshow(I_grey);title("原始图像");
imwrite(I_grey,"Img_grey.bmp","bmp");%输出灰度图像
F=fft2(I_grey);
F1=log(abs(F)+1);
subplot(2,2,2);imshow(F1,[]);title('傅里叶变换频谱图')
Pic_Phase_Spectrum=log(abs(F1*180/pi));
Pic_Restructure=ifft2(abs(F).*exp(j*angle(F)));
subplot(222);imshow(Pic_Phase_Spectrum,[]);title("傅里叶变换后相位谱图")
subplot(223);imshow(Pic_Restructure,[]);title("双谱反变换重构后图像")
%saveas(1,"three_pics",'bmp')
%进行三维绘图
[height,width]=size(I);
image=double(I);
%求出所有像素之和
sum_num  = 0;
for a = 1:1:height-1
    for b = 1:1:width-1
       sum_num = sum_num+image(a,b);%如果使用image(a,b),则有可能出现错误的结果
    end
end
for a = 1:1:height-1
    for b = 1:1:width-1
        image(a,b) = image(a,b)/sum_num;
    end
end
low1 = 115;high1 = 160;low2 = 100;high2 = 140;
% %采用mesh()函数绘图效果
% figure;
% max_val = max(max(image))
% [x, y] = meshgrid(low1:high1,low2:high2);
% z = image(low2:high2,low1:high1);  %%注意这里的顺序,先给的是列坐标
% mesh(x, y, z)
% axis([low1 high1 low2 high2 0 max_val])
% xlabel('Cr');
% ylabel('Cb');

%采用surf1()函数绘图效果
figure(2);
low1 = 115;high1 = 160;low2 = 100;high2 = 140;
max_val = max(max(image))
[x, y] = meshgrid(low1:high1,low2:high2);
z = image(low2:high2,low1:high1);  %%注意这里的顺序,先给的是列坐标
surfl(x, y, z)
axis([low1 high1 low2 high2 0 max_val])
xlabel('Cr');
ylabel('Cb');
其中,可以实现全部功能,如图:
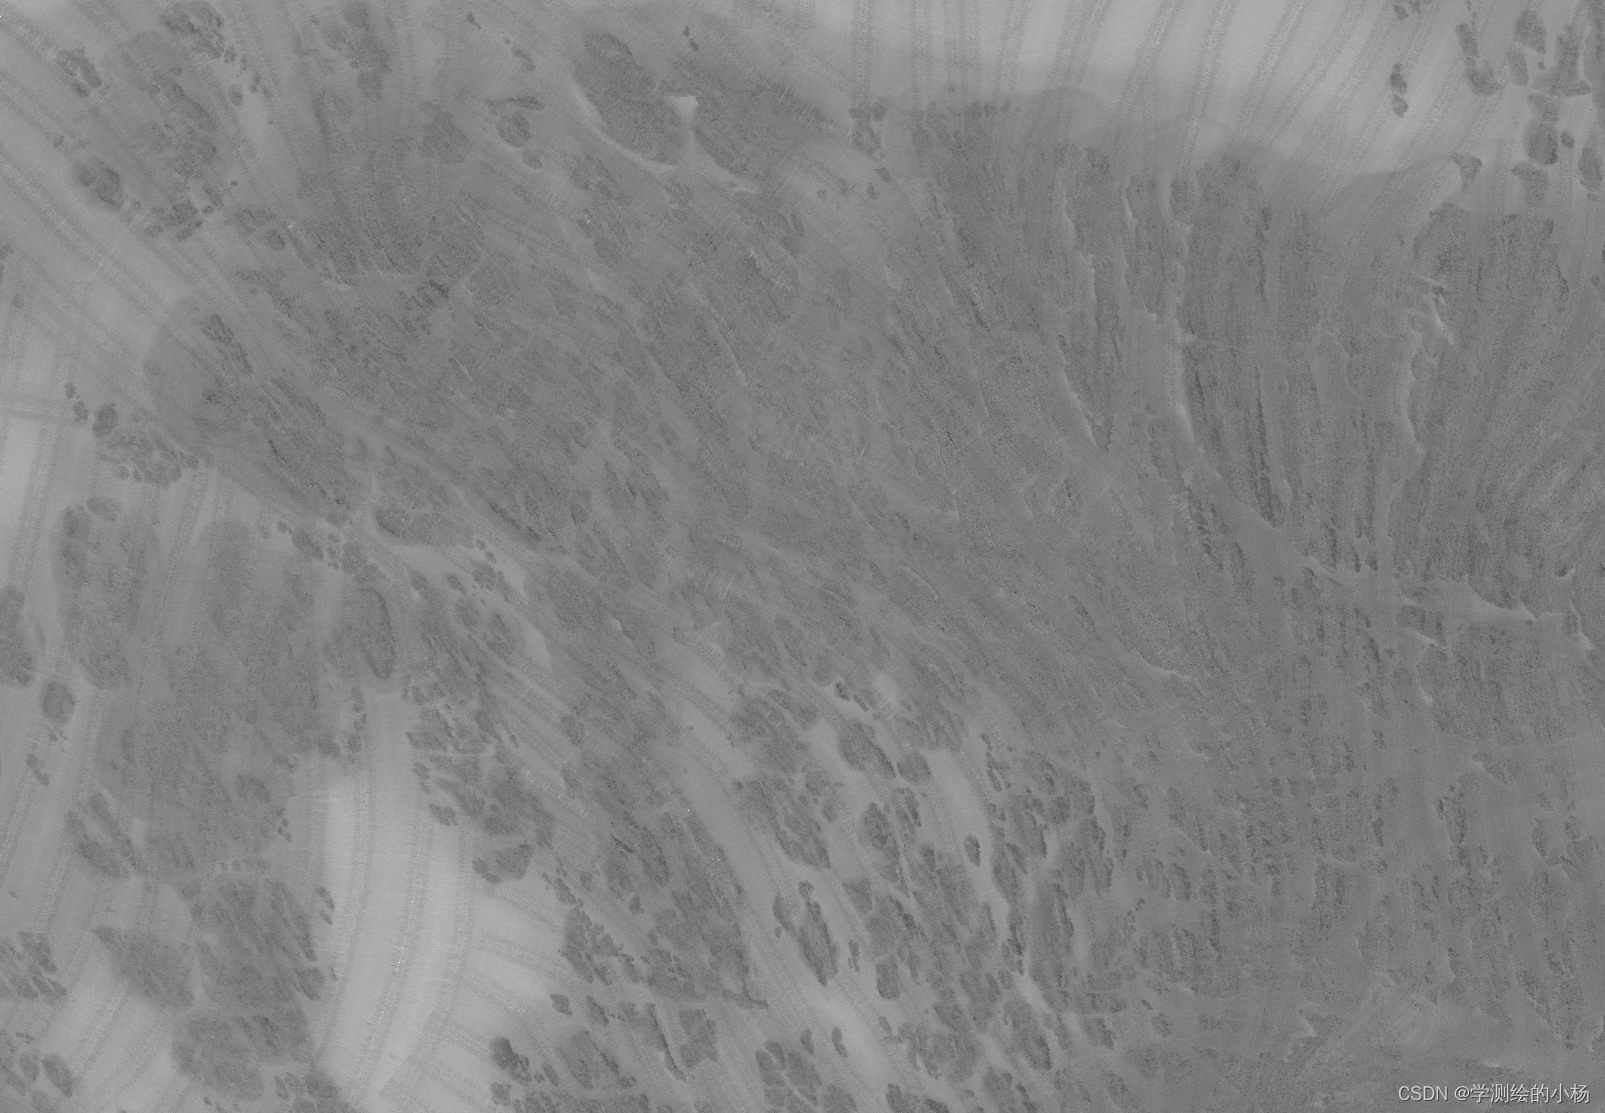
声纳图像
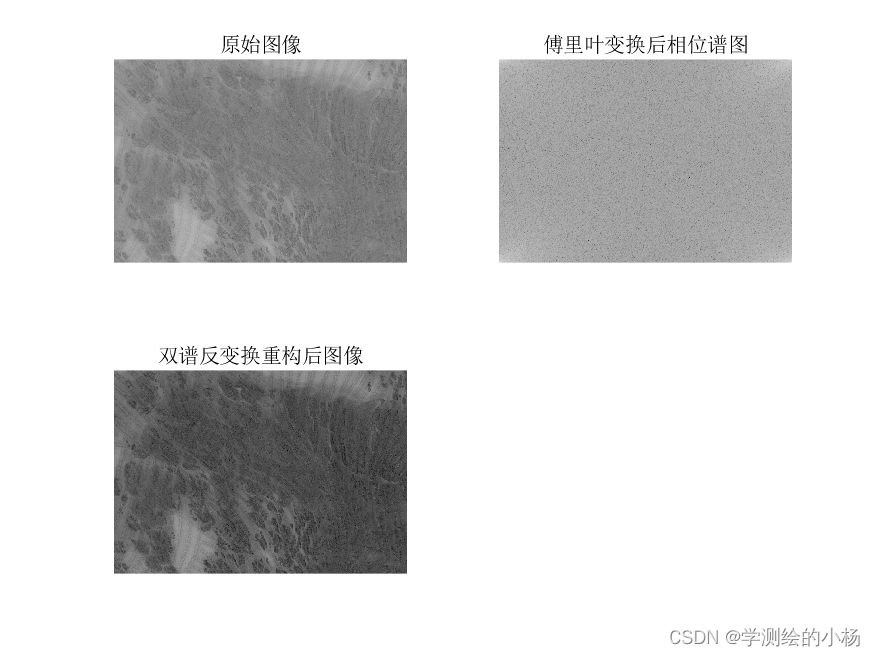
结果略图
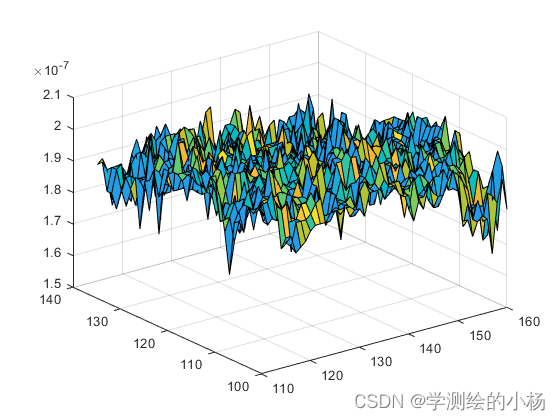
三维散点图