以下示例读取了4个txt文件中的内容,进行对比作图
import matplotlib.pyplot as plt
def loadData0(flieName1,flieName2):
inFile1 = open(flieName1, 'r')#以只读方式打开某fileName文件
inFile2 = open(flieName2, 'r')
#定义两个空list,用来存放文件中的数据
x = []
y = []
for index, line in enumerate(inFile1):
x.append(float(line))
for index,line in enumerate(inFile2):
y.append(float(line))
return x, y #注意,若返回的为元组(x, y),则画图的时候python不能区分大小
def loadData1(flieName1,flieName2):
inFile1 = open(flieName1, 'r')#以只读方式打开某fileName文件
inFile2 = open(flieName2, 'r')
#定义两个空list,用来存放文件中的数据
u = []
v = []
for index, line in enumerate(inFile1):
u.append(float(line))
for line in inFile2:
v.append(float(line))
return u, v
def plotData(x, y, u, v):
length = len(y)
print(length)
length = len(u)
print(length)
plt.figure(1)
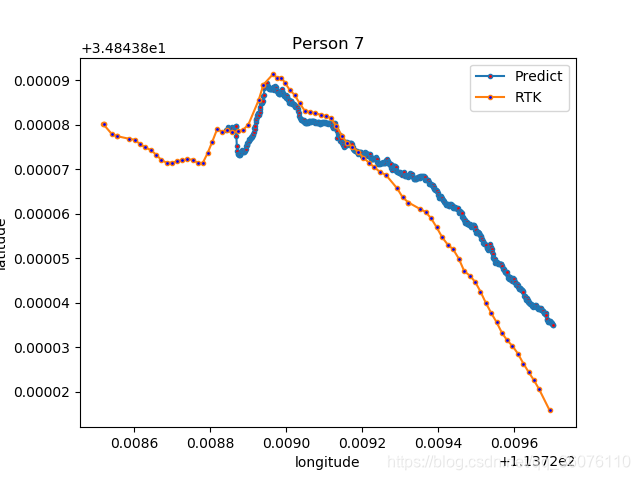
plt.plot(x, y, marker='.',linestyle='-',markerfacecolor='r',label='Predict')
plt.plot(u, v, marker='.',linestyle='-',markerfacecolor='b',label='RTK')
plt.xlabel("longitude")
plt.ylabel("latitude")
# plt.xticks([]) #不显示刻度
# plt.yticks([])
plt.title('Person 7')
plt.legend()
plt.show()#让绘制的图像在屏幕上显示出来
(x,y) = loadData0('jingdu_predict.txt','weidu_predict.txt')
(u,v) = loadData1('jingdu_rtk.txt','weidu_rtk.txt')
plotData(x,y,u,v)示例图如下: