画图之前一定要下载QCustomPlot,下载后还要在QT中引入QCustomPlot,然后拖出Widget控件,将其提升为QCustomPlot。
详细操作我在上个文章中写过,请参考QT绘图用QCustomPlot库,简单画一个曲线图,涉及了QCustomPlot的最基础知识(画图必用到的属性)_麦子穗的博客-CSDN博客_qt画曲线
先看运行后的效果图。
1654153283344
项目头文件代码:
1. 引入QCustomPlot的头文件(必须引入,不然会报错)
#include "qcustomplot.h"2. 在头文件中声明两个函数
selectDataGraph(QCustomPlot *customPlot);此函数用来绘图
selectData(QCustomPlot *customPlot);此函数用来设置选择数据的相关属性或者参数
// 绘图
    void        selectDataGraph(QCustomPlot *customPlot);
    // 选择图形中的数据
    void        selectData(QCustomPlot *customPlot);
3. 在头文件中声明私有槽函数用来实现数据选择和曲线的显示与隐藏
private slots:
    // 设置显示/隐藏菜单
    void contextMenuRequest(QPoint pos);
    // 选中图例中的项,或者选中曲线时
    void showGraph();
    // 被选中的曲线隐藏
    void hideGraph();
    // 显示框选数据
    void selectedShow();
项目文件.cpp代码:
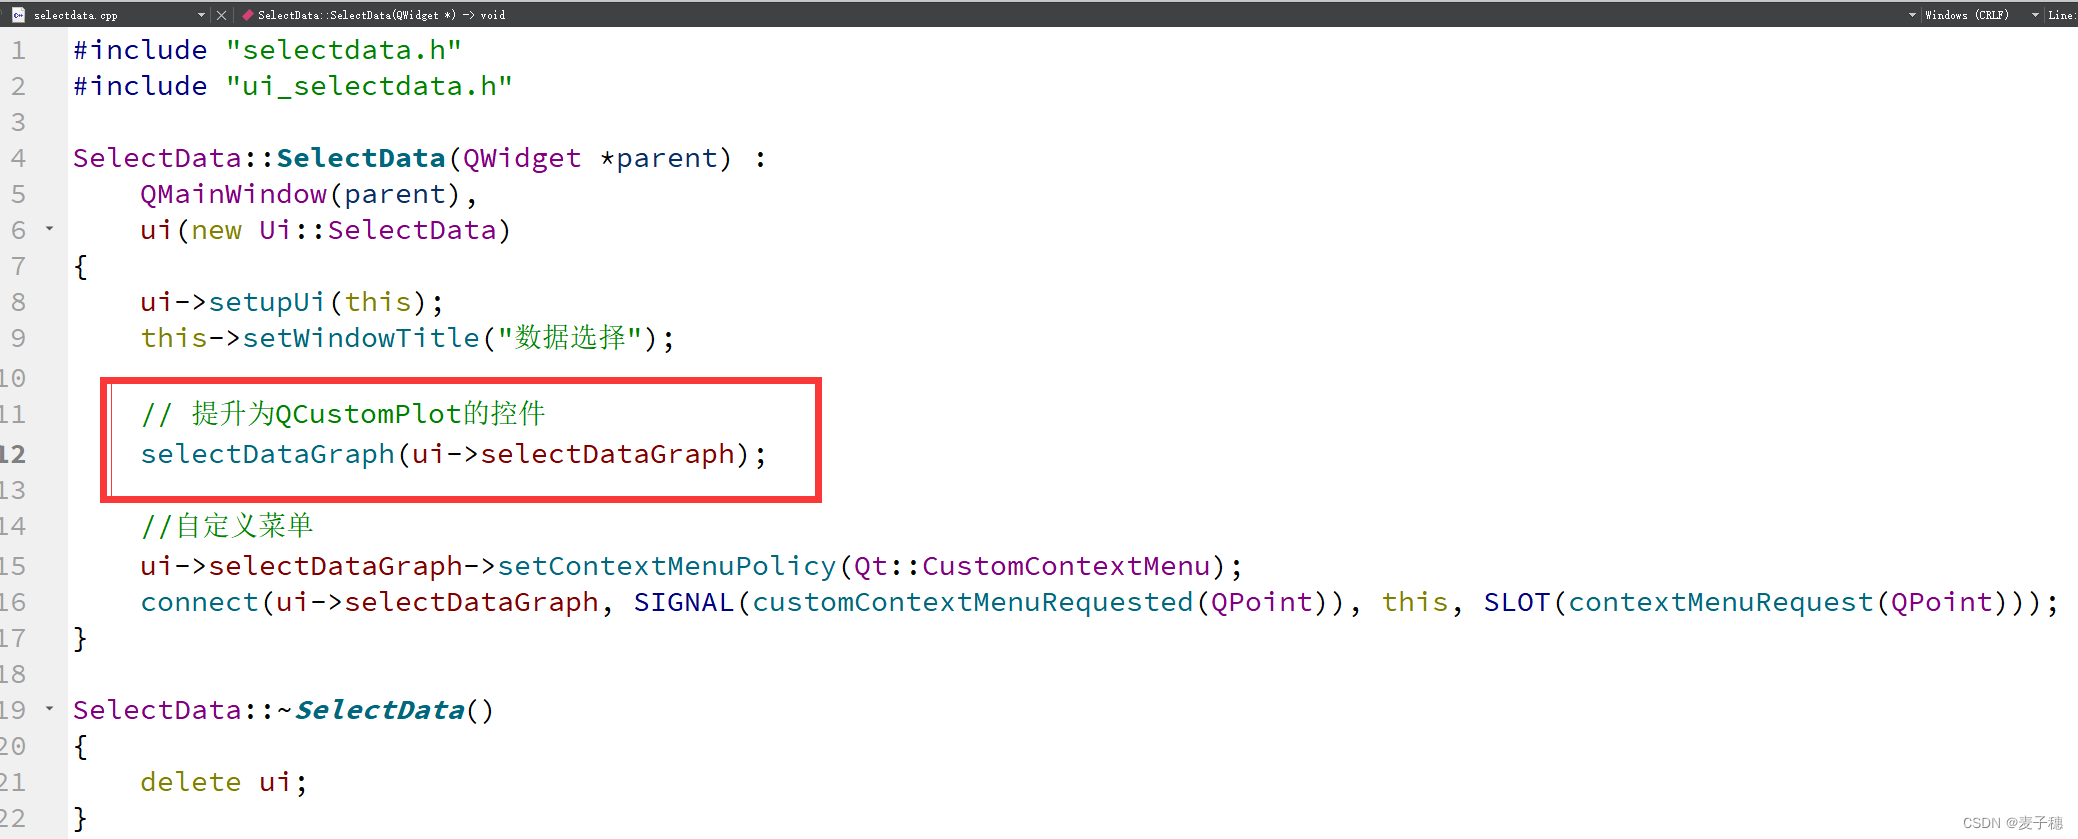
1. 在设计界面拖动一个Widget控件提升为QCustomPlot,此控件的类名设置为selectDataGraph。
在构造函数中调用绘图函数时,需要将此控件作为参数传进去。代码如下
2. 绘图函数代码实现
//绘图
void SelectData::selectDataGraph(QCustomPlot *customPlot)
{
    customPlot->legend->setVisible(true);
    customPlot->legend->setFont(QFont("Helvetica",9));

    QPen pen;
    //曲线风格
    QStringList lineNames;
    lineNames << "lsNone" << "lsLine" << "lsStepLeft" << "lsStepRight" << "lsStepCenter" << "lsImpulse";

    for(int i = QCPGraph::lsNone;i <= QCPGraph::lsImpulse; ++i)
    {
        customPlot->addGraph();
        pen.setColor(QColor(qSin(i*1+1.2)*80+80, qSin(i*0.3+0)*80+80, qSin(i*0.3+1.5)*80+80));
        customPlot->graph()->setPen(pen);//设置图表的画笔
        customPlot->graph()->setName(lineNames.at(i-QCPGraph::lsNone));
        customPlot->graph()->setLineStyle((QCPGraph::LineStyle)i);  // 设置图表线段的风格
        customPlot->graph()->setScatterStyle(QCPScatterStyle(QCPScatterStyle::ssCircle, 5));  // 设置图表散点图的样式

        //数据
        QVector<double> x(15), y(15);
        for (int j=0; j<15; ++j)
        {
            x[j] = j/15.0 * 5*3.14 + 0.01;
            y[j] = 7*qSin(x[j])/x[j] - (i-QCPGraph::lsNone)*5 + (QCPGraph::lsImpulse)*5 + 2;
        }

        customPlot->graph()->setData(x, y);
        customPlot->graph()->rescaleAxes(true);
    }

    //选中后,放大一点
    customPlot->xAxis->scaleRange(1.1,customPlot->xAxis->range().center());
    customPlot->yAxis->scaleRange(1.1,customPlot->yAxis->range().center());

    customPlot->xAxis->setTicks(true);
    customPlot->yAxis->setTicks(true);
    customPlot->xAxis->setTickLabels(true);
    customPlot->yAxis->setTickLabels(true);

    //标题元素
    customPlot->plotLayout()->insertRow(0);
    QCPTextElement *title = new QCPTextElement(customPlot, "数据与图例的选中,曲线的显示与隐藏,放大被框选数据", QFont("sans", 17, QFont::Bold));
    customPlot->plotLayout()->addElement(0, 0, title);

    customPlot->xAxis->setLabel("x轴");
    customPlot->yAxis->setLabel("y轴");

    customPlot->axisRect()->setupFullAxesBox();

    selectData(customPlot);
}
3. 数据选择代码实现:
//数据选择
void SelectData::selectData(QCustomPlot *customPlot)
{
    //交互设置                   拖拽                缩放                 选中轴            选中图例                选中图表标签             多选方式
    customPlot->setInteractions(QCP::iRangeDrag | QCP::iRangeZoom | QCP::iSelectAxes | QCP::iSelectLegend | QCP::iSelectPlottables | QCP::iMultiSelect);
    customPlot->setMultiSelectModifier(Qt::ControlModifier);// 使用ctrl键来多选
    customPlot->xAxis->setSelectableParts(QCPAxis::spAxis | QCPAxis::spAxisLabel | QCPAxis::spTickLabels);   // 轴的三个部分都可以被选择
    customPlot->yAxis->setSelectableParts(QCPAxis::spAxis | QCPAxis::spAxisLabel | QCPAxis::spTickLabels);

    customPlot->legend->setSelectableParts(QCPLegend::spItems);// 图例本身不能被选择,只有里面的项可以被选择
    customPlot->legend->setSelectedIconBorderPen(Qt::NoPen);// 设置图例里的项被选择时不显示Icon的边框

    customPlot->selectionRect()->setPen(QPen(Qt::black,1,Qt::DashLine));//设置选框的样式:虚线
    customPlot->selectionRect()->setBrush(QBrush(QColor(0,0,100,50)));//设置选框的样式:半透明浅蓝

    customPlot->setSelectionRectMode(QCP::SelectionRectMode::srmZoom);//被框选的曲线放大
    //鼠标框选选中曲线,解开以下注释可查看效果
//    customPlot->setSelectionRectMode(QCP::SelectionRectMode::srmSelect);//被框选的曲线放大
//    for (int i=0; i < customPlot->graphCount(); ++i) {
//           QCPGraph *graph = customPlot->graph(i);

//           //可以选择多个连续的数据点(一个数据范围)。
//           graph->setSelectable(QCP::stDataRange);
//       }

    // 连接QCustomPlot的信号,selectionChangedByUser表明是由鼠标点击进行的选择
    // 这里主要就是同步图表和图例的显示
    connect(customPlot, &QCustomPlot::selectionChangedByUser, this,&SelectData::selectedShow);
}
4. 选中图例中的项,或者选中曲线时
// 选中图例中的项,或者选中曲线时
void SelectData::selectedShow()
{
    for (int i=0; i < ui->selectDataGraph->graphCount(); ++i) {
        QCPGraph *graph = ui->selectDataGraph->graph(i);
        QCPPlottableLegendItem *item = ui->selectDataGraph->legend->itemWithPlottable(graph);//图例中的每一个项

        //选中图例中的项,或者选中曲线时,两者都被选中
        if (item->selected() || graph->selected())
        {
            graph->setSelection(QCPDataSelection(graph->data()->dataRange()));// 当图例项被选择时,选择图表全部的数据
            item->setSelected(true);
        }
    }
}
5. 设置显示/隐藏菜单
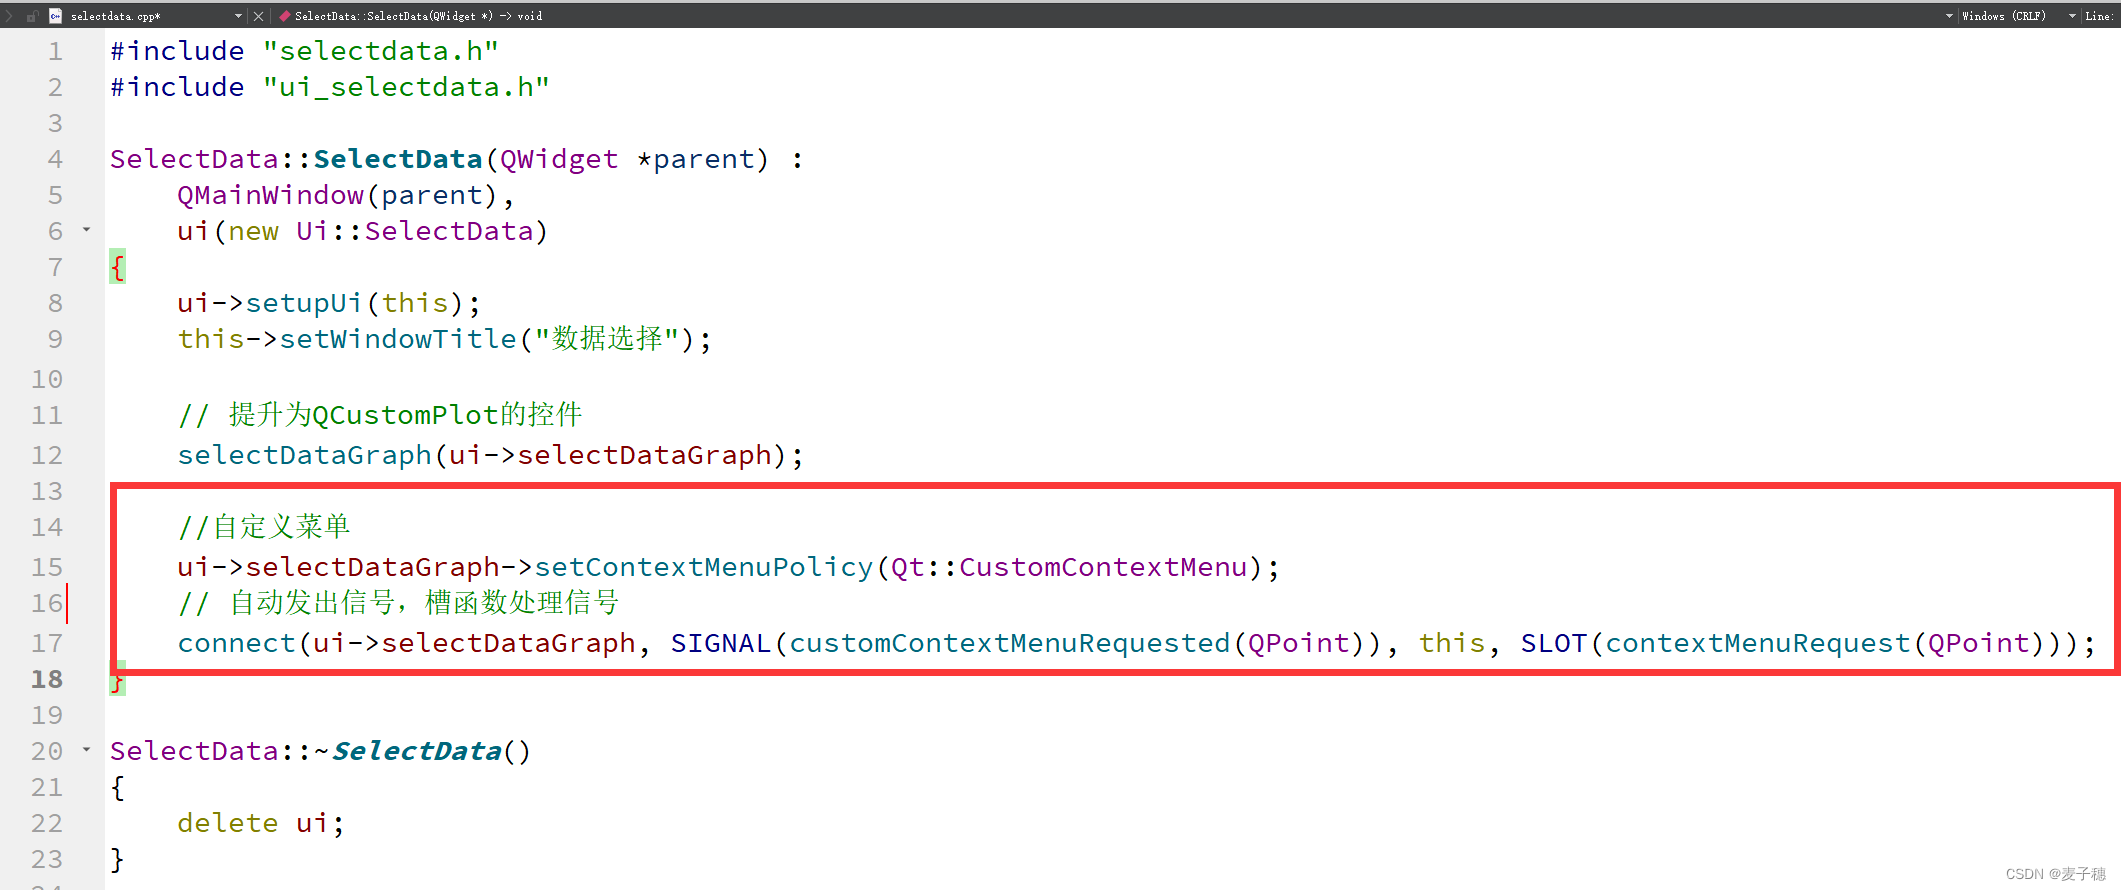
需要在构造函数中,设置自定义菜单,并连接信号。
//自定义菜单
    ui->selectDataGraph->setContextMenuPolicy(Qt::CustomContextMenu);
    // 自动发出信号,槽函数处理信号
    connect(ui->selectDataGraph, SIGNAL(customContextMenuRequested(QPoint)), this, SLOT(contextMenuRequest(QPoint)));
如图
函数实现:
// 设置显示/隐藏菜单
void SelectData::contextMenuRequest(QPoint pos)
{
    QMenu *menu = new QMenu(this);
    menu->setAttribute(Qt::WA_DeleteOnClose);

    double legendCounts = ui->selectDataGraph->legend->selectTest(pos, false);
    double graphCounts = ui->selectDataGraph->graph()->selectTest(pos,false);

    //图例菜单
    if (( legendCounts >= 0) || ( graphCounts >= 0))
    {
        menu->addAction("显示", this, SLOT(showGraph()));
        menu->addAction("隐藏", this, SLOT(hideGraph()));
    }

    menu->popup(ui->selectDataGraph->mapToGlobal(pos));
}
6.被选中的曲线显示
// 被选中的曲线显示
void SelectData::showGraph()
{
    for (int i=0; i<ui->selectDataGraph->graphCount(); ++i)
    {
        QCPGraph *graphItem = ui->selectDataGraph->graph(i);

        if (graphItem->selected())
        {
            graphItem->setVisible(true);
        }
    }
    ui->selectDataGraph->replot();
}
7. 被选中的曲线隐藏
// 被选中的曲线隐藏
void SelectData::hideGraph()
{
    for (int i=0; i< ui->selectDataGraph->graphCount(); ++i)
    {
        QCPGraph *graphItem = ui->selectDataGraph->graph(i);

        if (graphItem->selected())
        {
            graphItem->setVisible(false);
        }
    }
    ui->selectDataGraph->replot();
}
附赠源码
头文件源码:
#ifndef SELECTDATA_H
#define SELECTDATA_H

#include <QMainWindow>
#include "qcustomplot.h"

namespace Ui {
class SelectData;
}

class SelectData : public QMainWindow
{
    Q_OBJECT

public:
    explicit SelectData(QWidget *parent = nullptr);
    ~SelectData();

    // 绘图
    void        selectDataGraph(QCustomPlot *customPlot);
    // 选择图形中的数据
    void        selectData(QCustomPlot *customPlot);

private slots:
    // 设置显示/隐藏菜单
    void contextMenuRequest(QPoint pos);
    // 选中图例中的项,或者选中曲线时
    void showGraph();
    // 被选中的曲线隐藏
    void hideGraph();
    // 设置选中
    void selectedShow();

private:
    Ui::SelectData *ui;
};

#endif // SELECTDATA_H
.cpp源码
#include "selectdata.h"
#include "ui_selectdata.h"

SelectData::SelectData(QWidget *parent) :
    QMainWindow(parent),
    ui(new Ui::SelectData)
{
    ui->setupUi(this);
    this->setWindowTitle("数据选择");

    // 提升为QCustomPlot的控件
    selectDataGraph(ui->selectDataGraph);

    //自定义菜单
    ui->selectDataGraph->setContextMenuPolicy(Qt::CustomContextMenu);
    connect(ui->selectDataGraph, SIGNAL(customContextMenuRequested(QPoint)), this, SLOT(contextMenuRequest(QPoint)));
}

SelectData::~SelectData()
{
    delete ui;
}

//绘图
void SelectData::selectDataGraph(QCustomPlot *customPlot)
{
    customPlot->legend->setVisible(true);
    customPlot->legend->setFont(QFont("Helvetica",9));

    QPen pen;
    //曲线风格
    QStringList lineNames;
    lineNames << "lsNone" << "lsLine" << "lsStepLeft" << "lsStepRight" << "lsStepCenter" << "lsImpulse";

    for(int i = QCPGraph::lsNone;i <= QCPGraph::lsImpulse; ++i)
    {
        customPlot->addGraph();
        pen.setColor(QColor(qSin(i*1+1.2)*80+80, qSin(i*0.3+0)*80+80, qSin(i*0.3+1.5)*80+80));
        customPlot->graph()->setPen(pen);//设置图表的画笔
        customPlot->graph()->setName(lineNames.at(i-QCPGraph::lsNone));
        customPlot->graph()->setLineStyle((QCPGraph::LineStyle)i);  // 设置图表线段的风格
        customPlot->graph()->setScatterStyle(QCPScatterStyle(QCPScatterStyle::ssCircle, 5));  // 设置图表散点图的样式

        //数据
        QVector<double> x(15), y(15);
        for (int j=0; j<15; ++j)
        {
            x[j] = j/15.0 * 5*3.14 + 0.01;
            y[j] = 7*qSin(x[j])/x[j] - (i-QCPGraph::lsNone)*5 + (QCPGraph::lsImpulse)*5 + 2;
        }

        customPlot->graph()->setData(x, y);
        customPlot->graph()->rescaleAxes(true);
    }

    //选中后,放大一点
    customPlot->xAxis->scaleRange(1.1,customPlot->xAxis->range().center());
    customPlot->yAxis->scaleRange(1.1,customPlot->yAxis->range().center());

    customPlot->xAxis->setTicks(true);
    customPlot->yAxis->setTicks(true);
    customPlot->xAxis->setTickLabels(true);
    customPlot->yAxis->setTickLabels(true);

    //标题元素
    customPlot->plotLayout()->insertRow(0);
    QCPTextElement *title = new QCPTextElement(customPlot, "数据与图例的选中,曲线的显示与隐藏,放大被框选数据", QFont("sans", 17, QFont::Bold));
    customPlot->plotLayout()->addElement(0, 0, title);

    customPlot->xAxis->setLabel("x轴");
    customPlot->yAxis->setLabel("y轴");

    customPlot->axisRect()->setupFullAxesBox();

    selectData(customPlot);
}

//数据选择
void SelectData::selectData(QCustomPlot *customPlot)
{
    //交互设置                   拖拽                缩放                 选中轴            选中图例                选中图表标签             多选方式
    customPlot->setInteractions(QCP::iRangeDrag | QCP::iRangeZoom | QCP::iSelectAxes | QCP::iSelectLegend | QCP::iSelectPlottables | QCP::iMultiSelect);
    customPlot->setMultiSelectModifier(Qt::ControlModifier);// 使用ctrl键来多选
    customPlot->xAxis->setSelectableParts(QCPAxis::spAxis | QCPAxis::spAxisLabel | QCPAxis::spTickLabels);   // 轴的三个部分都可以被选择
    customPlot->yAxis->setSelectableParts(QCPAxis::spAxis | QCPAxis::spAxisLabel | QCPAxis::spTickLabels);

    customPlot->legend->setSelectableParts(QCPLegend::spItems);// 图例本身不能被选择,只有里面的项可以被选择
    customPlot->legend->setSelectedIconBorderPen(Qt::NoPen);// 设置图例里的项被选择时不显示Icon的边框

    customPlot->selectionRect()->setPen(QPen(Qt::black,1,Qt::DashLine));//设置选框的样式:虚线
    customPlot->selectionRect()->setBrush(QBrush(QColor(0,0,100,50)));//设置选框的样式:半透明浅蓝

    customPlot->setSelectionRectMode(QCP::SelectionRectMode::srmZoom);//被框选的曲线放大
    //鼠标框选选中曲线,解开以下注释可查看效果
//    customPlot->setSelectionRectMode(QCP::SelectionRectMode::srmSelect);//被框选的曲线放大
//    for (int i=0; i < customPlot->graphCount(); ++i) {
//           QCPGraph *graph = customPlot->graph(i);

//           //可以选择多个连续的数据点(一个数据范围)。
//           graph->setSelectable(QCP::stDataRange);
//       }

    // 连接QCustomPlot的信号,selectionChangedByUser表明是由鼠标点击进行的选择
    // 这里主要就是同步图表和图例的显示
    connect(customPlot, &QCustomPlot::selectionChangedByUser, this,&SelectData::selectedShow);
}

void SelectData::selectedShow()
{
    for (int i=0; i < ui->selectDataGraph->graphCount(); ++i) {
        QCPGraph *graph = ui->selectDataGraph->graph(i);
        QCPPlottableLegendItem *item = ui->selectDataGraph->legend->itemWithPlottable(graph);//图例中的每一个项

        //选中图例中的项,或者选中曲线时,两者都被选中
        if (item->selected() || graph->selected())
        {
            graph->setSelection(QCPDataSelection(graph->data()->dataRange()));// 当图例项被选择时,选择图表全部的数据
            item->setSelected(true);
        }
    }
}

void SelectData::contextMenuRequest(QPoint pos)
{
    QMenu *menu = new QMenu(this);
    menu->setAttribute(Qt::WA_DeleteOnClose);

    double legendCounts = ui->selectDataGraph->legend->selectTest(pos, false);
    double graphCounts = ui->selectDataGraph->graph()->selectTest(pos,false);

    //图例菜单
    if (( legendCounts >= 0) || ( graphCounts >= 0))
    {
        menu->addAction("显示", this, SLOT(showGraph()));
        menu->addAction("隐藏", this, SLOT(hideGraph()));
    }

    menu->popup(ui->selectDataGraph->mapToGlobal(pos));
}

void SelectData::showGraph()
{
    for (int i=0; i<ui->selectDataGraph->graphCount(); ++i)
    {
        QCPGraph *graphItem = ui->selectDataGraph->graph(i);

        if (graphItem->selected())
        {
            graphItem->setVisible(true);
        }
    }
    ui->selectDataGraph->replot();
}

void SelectData::hideGraph()
{
    for (int i=0; i< ui->selectDataGraph->graphCount(); ++i)
    {
        QCPGraph *graphItem = ui->selectDataGraph->graph(i);

        if (graphItem->selected())
        {
            graphItem->setVisible(false);
        }
    }
    ui->selectDataGraph->replot();
}
动手实践才是王道,各位小伙伴一起加油吧!!!