uCharts简介
uCharts是一款基于canvas API开发的适用于所有前端应用的图表库,开发者编写一套代码,可运行到 Web、iOS、Android(基于 uni-app / taro )、以及各种小程序(微信/支付宝/百度/头条/飞书/QQ/快手/钉钉/淘宝/京东/360)、快应用等更多支持 canvas API 的平台。
效果展示:演示 - uCharts跨平台图表库

步骤一:下载uCharts组件库,秋云 ucharts echarts 高性能跨全端图表组件 - DCloud 插件市场
步骤二: 引入组件库
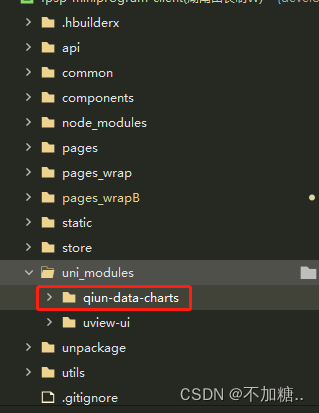
将下载的qiun-data-charts组件库直接引入uni_modules文件夹中,如图所示:
步骤三:引用组件
<qiun-data-charts class="charts"
type="ring" //图表类型
:chartData="chartData" //图表数据
:echartsApp="true" //【仅uni-app】是否在APP端使用ECharts引擎渲染图表
background="none" //背景颜色,默认透明rgba(0,0,0,0),开启滚动条后需要赋值为父元素的背景色
:tapLegend="false" //是否开启图例点击交互事件
:opts="opts" //uCharts图表配置参数
/>
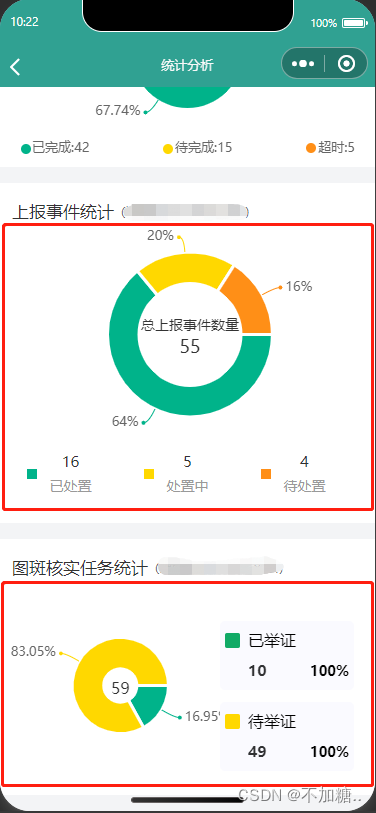
以圆环图 ring 为例:直接在页面引用即可。
<template>
	<view class="wrap">
		<view class="gzzl-wrap">
			<view class="title-content">
				<view class="word_1">上报事件统计</view>
				<view class="word_2">(xxx)</view>
			</view>
			<view v-if="show">
				<view class="data-wrap">
                    <!-- uCharts圆环图 ring  -->
					<qiun-data-charts class="charts" type="ring" :chartData="chartData" :echartsApp="true" background="none"
						:tapLegend="false" :opts="opts" />
				</view>
				<view class="task-content">
					<view class="item-task" v-for="(item, index) in menulist" :key="index">
						<view class="grid-sl">
							<u-input v-model="item.sl" border="none" inputAlign="center" readonly></u-input>
						</view>
						<text class="grid-text">{

   { item.text }}</text>
					</view>
				</view>
			</view>
			<view v-else style="margin-top: 128rpx;">
				<u-empty mode="data"></u-empty>
			</view>
		</view>
	</view>
</template>
<script>
export default {
	name: '',
	components: {},
	props: {},
	data () {
		return {
			show: false,
			formData: {},
			params: {},
			chartData: {
				"series": [
					{
						"data": [
							{
								"name": "已处置",
								"value": 0
							},
							{
								"name": "处置中",
								"value": 0
							},
							{
								"name": "待处置",
								"value": 0
							}
						]
					}
				]
			},
			menulist: [
				{
					text: '已处置',
					sl: 0
				},
				{
					text: '处置中',
					sl: 0
				},
				{
					text: '待处置',
					sl: 0
				},
			],
			opts: {
				title: {
					name: "总上报事件数量",
					fontSize: 14,
					color: "#333333"
				},
				subtitle: {
					name: "0",
					fontSize: 18,
					color: "#333333"
				},
			},
		}
	},
	mounted () {
		this.loadData()
	},
	methods: {
		loadData () {
			this.chartData.series[0].data[0].value = 16;
			this.menulist[0].sl = 16;
            this.chartData.series[0].data[1].value = 5;
			this.menulist[1].sl = 5;
            this.chartData.series[0].data[2].value = 4;
			this.menulist[2].sl = 4;
            this.opts.subtitle.name = Number(this.menulist[0].sl) + Number(this.menulist[1].sl) + Number(this.menulist[2].sl)
				if (this.opts.subtitle.name == '0') {
					this.show = false
				} else {
					this.show = true
				}
		},
	}
}
</script>

<style lang="scss" scoped>
.gzzl-wrap {
	position: relative;
	width: 100%;
	height: auto;
	padding: 24rpx;
	background-color: #FFFFFF;
	margin-top: 32rpx;

	.title-content {
		display: flex;
		flex-direction: row;
		align-items: center;
		position: relative;
		width: 100%;
		height: 64rpx;

		.word_1 {
			color: #333333;
			font-size: 34rpx;
		}

		.word_2 {
			color: #666666;
			font-size: 24rpx;
		}
	}

	.data-wrap {
		position: relative;
		width: 100%;
		height: 420rpx;
	}

	.charts {
		height: 420rpx;
	}

	.task-content {
		display: flex;
		flex-direction: row;
		position: relative;
		width: 100%;
		height: auto;
		padding: 24rpx 0;
		background-color: #FFFFFF;

		.item-task {
			position: relative;
			display: flex;
			flex: 1;
			flex-direction: column;
			justify-content: center;
			align-items: center;
			line-height: 52rpx;

			.grid-text {
				color: #999999;
				font-size: 28rpx;
			}

			.grid-sl {
				font-size: 40rpx;
				color: #333333;
				width: 56%;
			}
		}

		.item-task:nth-child(1):before {
			content: '';
			position: absolute;
			left: 30rpx;
			width: 20rpx;
			height: 20rpx;
			background-color: #00B38A;
		}

		.item-task:nth-child(3):after {
			content: '';
			position: absolute;
			left: 30rpx;
			width: 20rpx;
			height: 20rpx;
			background-color: #FF8F17;
		}

		.item-task:nth-child(2):after {
			content: '';
			position: absolute;
			left: 30rpx;
			width: 20rpx;
			height: 20rpx;
			background-color: #FFD800;
		}
	}
}
</style>