问题描述:
本人在jupyter lab中用plotly绘图时,发现fig.show()并不显示图像,而是一片空白,代码如下:
import plotly.express as px
from sklearn.datasets import load_iris
from sklearn.ensemble import IsolationForest

data = load_iris(as_frame=True)
X,y = data.data,data.target
df = data.frame

iforest = IsolationForest(n_estimators=100, max_samples='auto',
                          contamination=0.05, max_features=4,
                          bootstrap=False, n_jobs=-1, random_state=1)

pred= iforest.fit_predict(X)
df['scores']=iforest.decision_function(X)
df['anomaly_label']=pred

df['anomaly']=df['anomaly_label'].apply(lambda x: 'outlier' if x==-1 else 'inlier')

fig = px.scatter_3d(df,x='petal width (cm)',
                        y='sepal length (cm)',
                        z='sepal width (cm)',
                        color='anomaly')
fig.show()
问题解决:
加入Html模块进行显示,即可。
建议jupyter lab中同时安装jupyter-matplotlib、jupyterlab-chart-editor的拓展包,让可视化更便捷。
代码修改:
from IPython.display import HTML # 导入HTML

...

HTML(fig.to_html()) # to_html()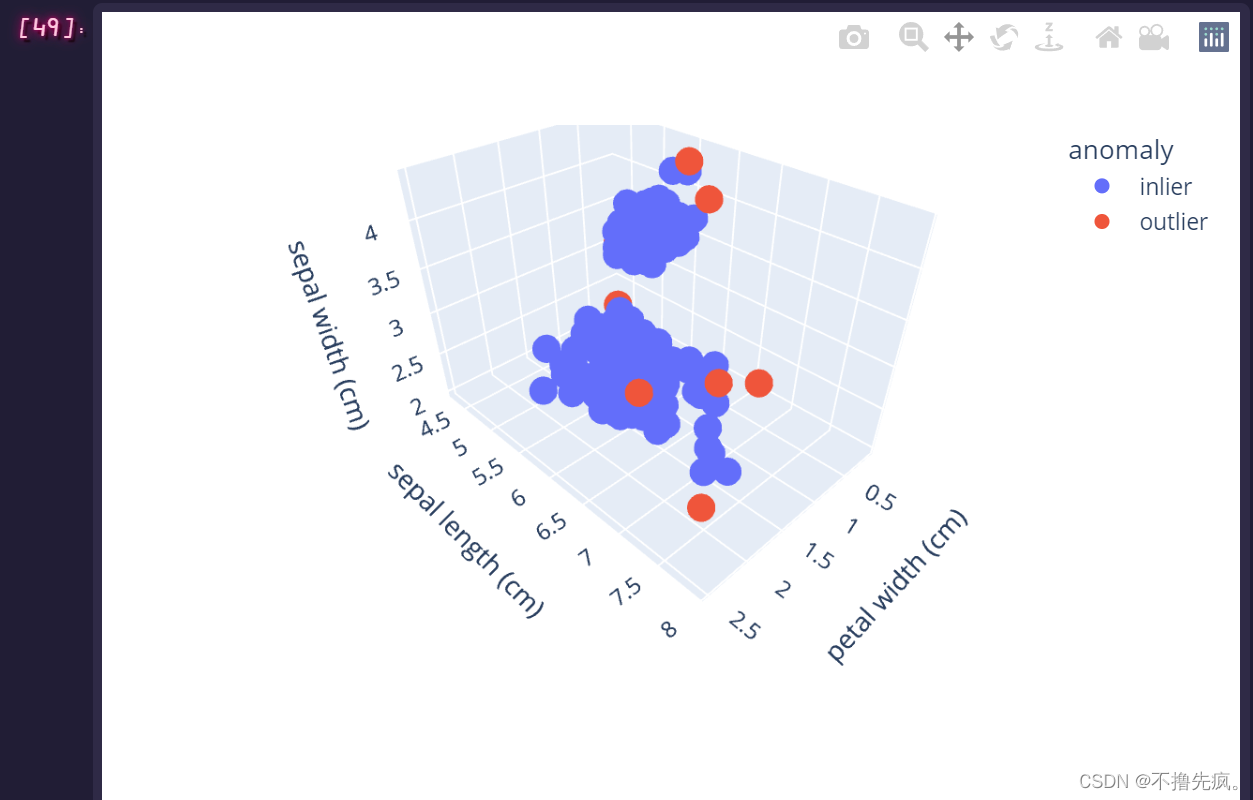
成果解决,效果完美!