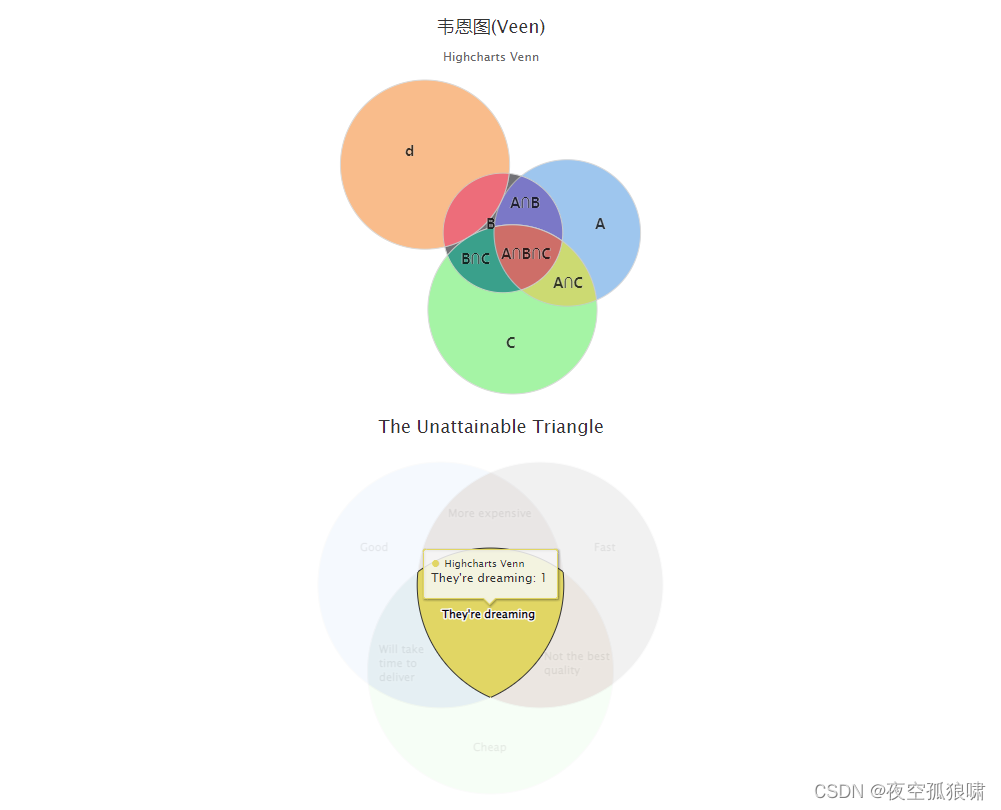
Highcharts 写 venn图 鼠标悬浮效果以及点击事件
效果图如下:
具体方法
安装包依赖:npm install highcharts
//组件中引入
import Highcharts from 'highcharts';
// import exportingInit from 'highcharts/modules/exporting';
// exportingInit(Highcharts)
// import stockInit from 'highcharts/modules/stock'
// stockInit(Highcharts)
// 这里的venn.js放到mian.js中去引用
// import venn from 'highcharts/modules/venn'
// venn(HighCharts);
只在上面引入会报错
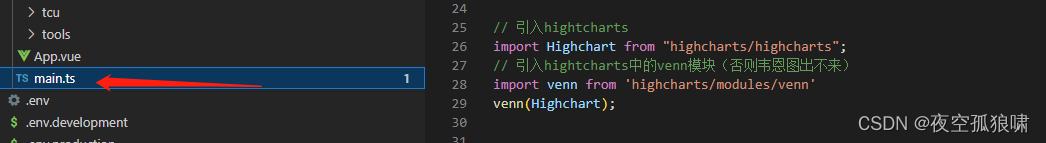
在main.js中引入venn.js(解决报错)
// 引入hightcharts
import Highchart from "highcharts/highcharts";
// 引入hightcharts中的venn模块(否则韦恩图出不来)
import venn from 'highcharts/modules/venn'
venn(Highchart);
下面具体代码如下:
html代码:这里两个图
      <div id="container"></div>
      <div id="container2"></div>
Highcharts.chart('container2', {
series: [{
type: 'venn',
name: 'Highcharts Venn',
data: [{
sets: ['Good'],
value: 2
}, {
sets: ['Fast'],
value: 2
}, {
sets: ['Cheap'],
value: 2
}, {
sets: ['Good', 'Fast'],
value: 1,
name: 'More expensive'
}, {
sets: ['Good', 'Cheap'],
value: 1,
name: 'Will take time to deliver'
}, {
sets: ['Fast', 'Cheap'],
value: 1,
name: 'Not the best quality'
}, {
sets: ['Fast', 'Cheap', 'Good'],
value: 1,
name: 'They\'re dreaming'
}]
}],
title: {
text: 'The Unattainable Triangle'
}
});
var datas = [
{
sets: ['A'],
value: 3,
other: '123sfdfzsdfsdf3',
}, {
sets: ['B'],
value: 2,
other: '1233',
}, {
sets: ['C'],
value: 4,
}, {
sets: ['d'],
value: 4,
}, {
sets: ['A', 'B'],
value: 1,
name: 'A∩B',
}, {
sets: ['d', 'B'],
value: 1,
name: 'd∩B',
// other:'666',
}, {
sets: ['A', 'C'],
value: 1,
name: 'A∩C',
}, {
sets: ['B', 'C'],
value: 1,
name: 'B∩C',
}, {
sets: ['A', 'B', 'C'],
value: 1,
name: 'A∩B∩C',
}
];
Highcharts.chart('container', {
series: [{
type: 'venn',
data: datas,
cursor: 'pointer',
showInLegend: false,
dataLabels: {
enabled: true,
align: 'center',
style: {
color: "black",
fontSize: "14px",
fontWeight: "bold", //nomal
textOutline: "0px 0px contrast",
fontFamily: 'Microsoft YaHei',
}
},
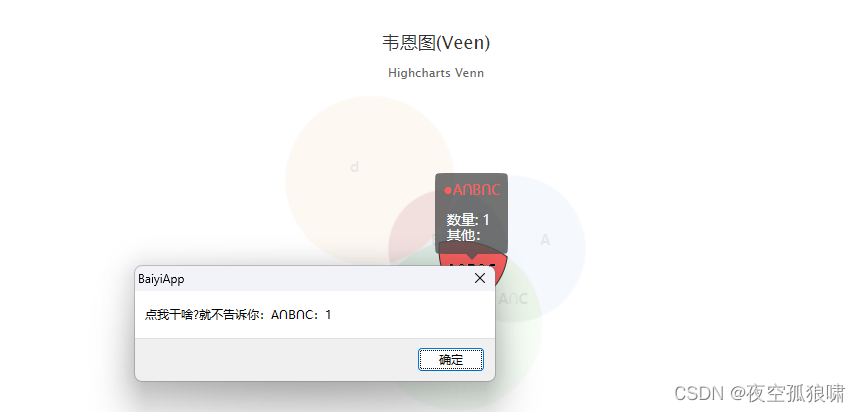
events: {
//单击事件
click: function (e) {
console.log(e.point.name + ":" + e.point.value);
alert('点我干啥?就不告诉你:' + e.point.name + ":" + e.point.value)
// location.href = "http://www.baidu.com";
},
}
}],
title: {
text: '韦恩图(Veen)'
},
subtitle: {
text: 'Highcharts Venn',
align: 'center',
style: {
}
},
tooltip: {
backgroundColor: 'rgba(82,82,82,0.8)',
borderColor: '#525252', // 边框颜色
borderRadius: 10, // 边框圆角
borderWidth: 0, // 边框宽度
shadow: false, // 是否显示阴影
animation: true, // 是否启用动画效果
headerFormat: '',
pointFormat: `
<span style="color:{point.color};font-size:14px;font-family:Microsoft YaHei">\u25CF{point.name}</span><br/><br/>
<span style="color:white;font-size:14px;font-family:Microsoft YaHei">
数量: {point.value}
</span><br/>
<span style="color:white;font-size:14px;font-family:Microsoft YaHei">
其他:{point.other}
</span><br/>
`
// +'占比: <b style="font-size: 14px,color:#eee">{point.percentage:.2f}%</b><br/>'
}
});
单独的html文件写highcharts
<!DOCTYPE html>
<html>

<head>
	<meta charset="utf-8" />
	<meta name="viewport" content="width=device-width, initial-scale=1">
	<meta http-equiv="x-ua-compatible" content="ie=edge">
	<title></title>

	<!-- 注意引种js,以及顺序 -->
	<script src="js/highcharts.js"></script>
	<script src="js/oldie.js"></script>
	<script src="js/venn.js"></script>
	<script src="js/grid-light.js"></script>
	<script src="js/drilldown.js"></script>

</head>

<body>

	<div id="container"></div>


	<script>


		var datas = [
			{


				sets: ['A'],
				value: 3,
				other: '123sfdfzsdfsdf3',
			}, {


				sets: ['B'],
				value: 2,
				other: '1233',

			}, {


				sets: ['C'],
				value: 4,
			}, {


				sets: ['d'],
				value: 4,
			}, {


				sets: ['A', 'B'],
				value: 1,
				name: 'A∩B',
			}, {


				sets: ['d', 'B'],
				value: 1,
				name: 'd∩B',
			}, {


				sets: ['A', 'C'],
				value: 1,
				name: 'A∩C',
			}, {


				sets: ['B', 'C'],
				value: 1,
				name: 'B∩C',
			}, {


				sets: ['A', 'B', 'C'],
				value: 1,
				name: 'A∩B∩C',
			}
		];

		Highcharts.chart('container', {


			series: [{


				type: 'venn',
				data: datas,
				cursor: 'pointer',
				showInLegend: false,
				dataLabels: {


					enabled: true,
					align: 'center',
					style: {


						color: "black",
						fontSize: "14px",
						fontWeight: "bold", //nomal
						textOutline: "0px 0px contrast",
						fontFamily: 'Microsoft YaHei',
					}
				},
				events: {


					//单击事件
					click: function (e) {


						console.log(e.point.name + ":" + e.point.value);

						//链接到新页面
						//window.open('http://www.baidu.com','_self','width=200,height=100');
						// location.href = "http://www.baidu.com";
					},
				}
			}],
			title: {


				text: '韦恩图(Veen)'
			},
			subtitle: {


				text: '数据来源:个人编造',
				align: 'center',
				style: {

      }
			},
			tooltip: {


				backgroundColor: 'rgba(82,82,82,0.8)',
				borderColor: '#525252',         // 边框颜色
				borderRadius: 10,             // 边框圆角
				borderWidth: 0,               // 边框宽度
				shadow: false,                 // 是否显示阴影
				animation: true,               // 是否启用动画效果
				headerFormat: '',
				pointFormat: `
						<span style="color:{point.color};font-size:14px;font-family:Microsoft YaHei">\u25CF{point.name}<br/></span>
						<span style="color:white;font-size:14px;font-family:Microsoft YaHei">
							数量: {point.value}<br/>
						</span><br/>
						<span style="color:white;font-size:14px;font-family:Microsoft YaHei">
							其他:{point.other}
						</span><br/>
						`
				// +'占比: <b style="font-size: 14px,color:#eee">{point.percentage:.2f}%</b><br/>'
			}

		});


	</script>

</body>

</html>