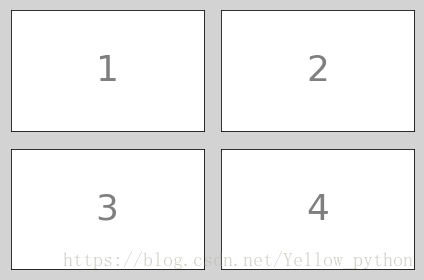
subplot
Return a subplot axes at the given grid position.
import matplotlib.pyplot as mp
mp.figure(facecolor='lightgray')
for i in range(4):
mp.subplot(2,2,i+1)
mp.xticks(())
mp.yticks(())
mp.text(0.5, 0.5, str(i+1), ha='center', va='center', size=36, alpha=0.5)
mp.tight_layout()
mp.show()
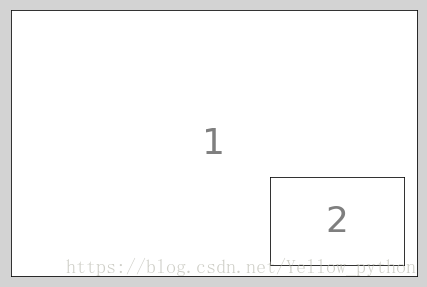
axes
Add an axes to the figure.
import matplotlib.pyplot as mp
mp.figure(facecolor='lightgray')

mp.axes([0.03, 0.038, 0.94, 0.924])
mp.xticks(())
mp.yticks(())
mp.text(0.5, 0.5, '1', ha='center', va='center', size=36, alpha=0.5)

mp.axes([0.63, 0.076, 0.31, 0.308])
mp.xticks(())
mp.yticks(())
mp.text(0.5, 0.5, '2', ha='center', va='center', size=36, alpha=0.5)

mp.show()