一.项目介绍:
为了更好的观察京沪深的走向趋势,抛开大盘指数,对真实数据进行范围统计,从而得出市场表现
二.项目准备:
1.有数据库环境和python的环境
2.有获取的数据
3.python中导入我们用到的两个lib
import MySQLdb
import matplotlib.pyplot as plt
三.项目运行效果:
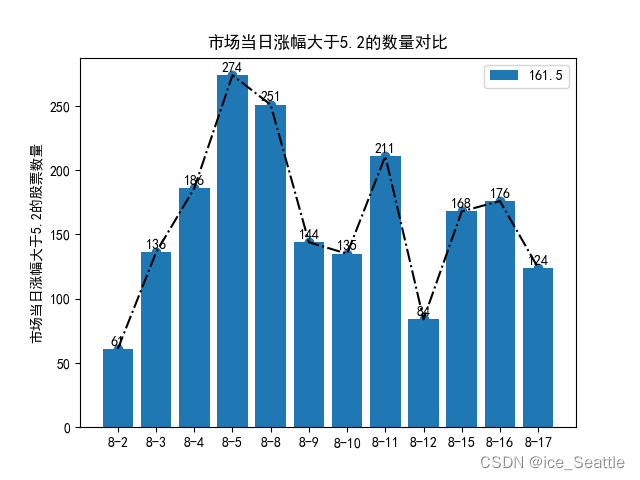
四.分部过程讲解
1.编写存储过程:
这里用的是select的嵌套,一般来说连接查询更快一些,我这里为了方便,调用结果就是此范围内的大于设定涨幅的统计结果,对此我只取了12条,后面的数据放在了rnc_1,rnc_2后面等等,方便调用

2.数据库提取表名并处理
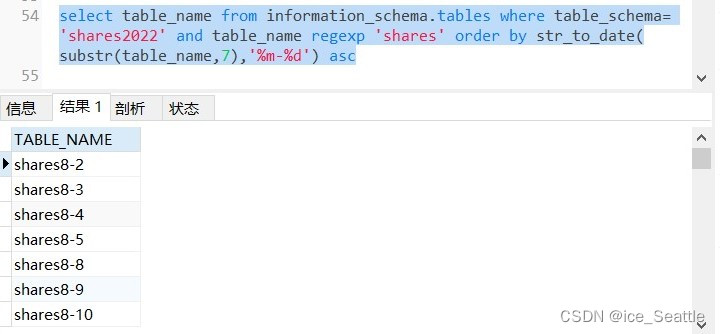
由于为了书写方便,我存入的表为shares8-2等等字样,不想每次都在python中每次手动录入列表不同的日期,而使用kettle工具输出查询结果再调用过程繁琐复杂,所以我想到了在查询中截取表名作为列表中的数据参数
select table_name from information_schema.tables此时所有表名都会列出来,但是有你不想要的表,所以我们使用where指定数据库,并使用正则regexp限定查找范围,经过排序发现排序是按照先后顺序一个字符一个字符的去查,出现了8-10等等会比8-2排在前面,因此我们使用str_to_date()函数将字符串的后面转换为日期,此时效果如下
因为要使用python处理,对此我们只需要查询截取的部位
select substr(table_name,7) from information_schema.tables
where table_schema= '{database}' and table_name regexp 'shares'
order by str_to_date(substr(table_name,7),'%m-%d') asc
对于从后面截取一部分日期可使用limit 初始位置,记录数
如将前面rnc函数改成rnc_1,rnc_1为 8-18到9-2的12条记录,即可以将SQL如下输出
SQL = f"""select substr(table_name,7) from information_schema.tables
where table_schema= '{database}' and table_name regexp 'shares'
order by str_to_date(substr(table_name,7),'%m-%d') asc limit 12,12"""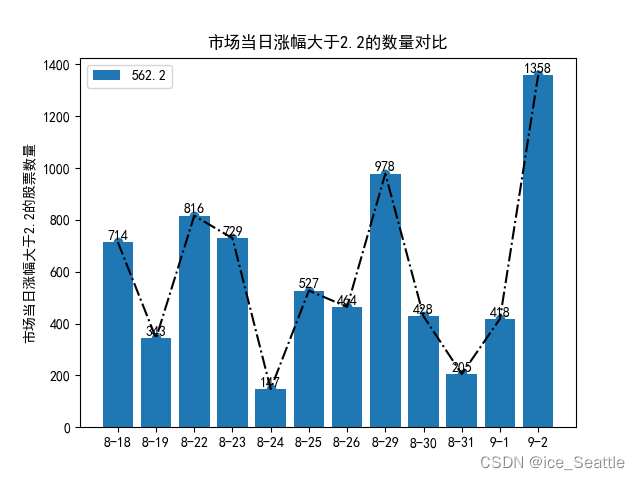
如图,此时调用存储过程rnc_1,Rise变量取值2.2,SQL后加了limit 12,12的结果
为了批量生成limit序列,并可控的放入到sql语句中,我们定义以下函数
# 定义 limit 分页操作的组数
limit_group = 12
list_m = []
list_n = []


def limit_m(m):
    for k in range(0, m, limit_group):
        list_m.append(str(k))
    return list_m


def limit_n(n):
    for k in range(0, len(m)):
        list_n.append(f',{str(n)}')
    return list_n


limit = []
m = limit_m(601)
n = limit_n(limit_group)

for i in range(0, len(m)):
    limit.append(m[i]+n[i])
print(limit)
['0,12', '12,12', '24,12', '36,12', '48,12', '60,12', '72,12', '84,12', '96,12', '108,12', '120,12', '132,12', '144,12', '156,12', '168,12', '180,12', '192,12', '204,12', '216,12', '228,12', '240,12', '252,12', '264,12', '276,12', '288,12', '300,12', '312,12', '324,12', '336,12', '348,12', '360,12', '372,12', '384,12', '396,12', '408,12', '420,12', '432,12', '444,12', '456,12', '468,12', '480,12', '492,12', '504,12', '516,12', '528,12', '540,12', '552,12', '564,12', '576,12', '588,12', '600,12']
对此将limit列表循环索引,即可获得分组后对应的分页结果
SQL = f"""select substr(table_name,7) from information_schema.tables
where table_schema= '{database}' and table_name regexp 'shares'
order by str_to_date(substr(table_name,7),'%m-%d') asc limit {limit[2]}"""
['9-5', '9-6', '9-7', '9-8', '9-9', '9-13', '9-14', '9-15', '9-16', '9-19', '9-20', '9-21']
3.数据库中抽取数据加载数据到python中
注释应该很明确了,可以加print()函数对载入的数据进行测试及调试
# _*_ coding:utf-8 _*_
# @Time    : 2022/9/13 22:26
# @Author  : ice_Seattle
# @File    : 股票离散涨幅数量对比.py
# @Software: PyCharm


import MySQLdb
import matplotlib.pyplot as plt
# 打开数据库连接
db = MySQLdb.connect("localhost", "root", "489000", "shares2022", charset='utf8')
# 使用cursor()方法获取操作游标
cursor = db.cursor()
# 使用execute方法执行SQL语句
cursor.execute("SELECT VERSION()")
# 使用 fetchone() 方法获取一条数据
version = cursor.fetchone()
print("Database version : %s " % version)
# 设置要查询>=Rise的股票的临界值
Rise = 5
sql = f"""CALL rnc_2('{Rise}')"""
cursor.execute(sql)
# SQL语句预处理,获取某个数据库中以shares所匹配到的所有表名,并将表的末端字符串转换为日期格式升序排序
SQL = f"""select substr(table_name,7) from information_schema.tables
where table_schema= '{database}' and table_name regexp 'shares'
order by str_to_date(substr(table_name,7),'%m-%d') asc limit {limit[2]}"""
cursor.execute(SQL)
list2 = []
for i in range(1, 10000):
    data = cursor.fetchone()
    # 因存储过程中查询嵌套的子查询为12条,所以数据为第13条时退出
    if data is None or i == 13:
        break
    else:
        # 此时循环每组元组的第一个索引存储到列表中,此处写循环是为了方便修改
        for j in range(1, 2):
            list2.append(data[j-1])
shares = list2
print(shares)
# 关闭数据库连接
db.close()
4.matplotlib可视化处理
# 以figure外框,axes内框创建多维窗口
fig, ax = plt.subplots()
# 计算平均值
means = sum(sorted(rise_num)[1:-1])/len(rise_num[1:-1])
b = ax.bar(shares, rise_num, label='{}'.format(means))
for a, b in zip(shares, rise_num):
    ax.text(a, b+1, b, ha='center', va='bottom')

plt.rcParams['font.sans-serif'] = ['SimHei']  # 用来正常显示中文标签
plt.rcParams['axes.unicode_minus'] = False   # 用来正常显示负号
plt.ylabel(f"市场当日涨幅大于{Rise}的股票数量")
plt.title(f"市场当日涨幅大于{Rise}的数量对比")
# 条形图默认宽为0.8,因使用了zip此处不需要矫,xs这条可以不用,所以这里+0.0
xs = [i + 0.0 for i, _ in enumerate(shares)]
# 使名字标记x轴,位置在x轴上条形中心
plt.xticks(xs, shares)
plt.plot(shares, rise_num, 'o')
plt.plot(xs, rise_num, 'k-.')  # 黑色虚线
plt.legend()
# 保存图片
plt.savefig(f'{shares[0]}~{shares[-1]}涨幅大于{Rise}股票数量.png')
plt.show()
五.完整代码:
# _*_ coding:utf-8 _*_
# @Time    : 2022/9/13 22:26
# @Author  : ice_Seattle
# @File    : 股票离散涨幅数量对比.py
# @Software: PyCharm


import MySQLdb
import matplotlib.pyplot as plt
# 打开数据库连接
db = MySQLdb.connect("localhost", "root", "489000", "shares2022", charset='utf8')
# 使用cursor()方法获取操作游标
cursor = db.cursor()
# 使用execute方法执行SQL语句
cursor.execute("SELECT VERSION()")
# 使用 fetchone() 方法获取一条数据
version = cursor.fetchone()
print("Database version : %s " % version)
# 设置要查询>=Rise的股票的临界值
Rise = 5
sql = f"""CALL rnc_2('{Rise}')"""
cursor.execute(sql)
# 定义列表, 循环下标
list1 = []
for i in range(1, 10000):
    data = cursor.fetchone()
    if data is None:
        break
    else:
        for j in range(1, 13):
            list1.append(data[j-1])
rise_num = list1
# 定义变量,将数据库名赋给所定义的变量
database = 'shares2022'
# 定义 limit 分页操作的组数
limit_group = 12
list_m = []
list_n = []


def limit_m(m):
    for k in range(0, m, limit_group):
        list_m.append(str(k))
    return list_m


def limit_n(n):
    for k in range(0, len(m)):
        list_n.append(f',{str(n)}')
    return list_n


limit = []
m = limit_m(601)
n = limit_n(limit_group)

for i in range(0, len(m)):
    limit.append(m[i]+n[i])
print(limit)
# SQL语句预处理,获取某个数据库中以shares所匹配到的所有表名,并将表的末端字符串转换为日期格式升序排序
SQL = f"""select substr(table_name,7) from information_schema.tables
where table_schema= '{database}' and table_name regexp 'shares'
order by str_to_date(substr(table_name,7),'%m-%d') asc limit {limit[2]}"""
cursor.execute(SQL)
list2 = []
for i in range(1, 10000):
    data = cursor.fetchone()
    # 因存储过程中查询嵌套的子查询为12条,所以数据为第13条时退出
    if data is None or i == 13:
        break
    else:
        # 此时循环每组元组的第一个索引存储到列表中,此处写循环是为了方便修改
        for j in range(1, 2):
            list2.append(data[j-1])
shares = list2
print(shares)
# 关闭数据库连接
db.close()

# 以figure外框,axes内框创建多维窗口
fig, ax = plt.subplots()
# 计算平均值
means = sum(sorted(rise_num)[1:-1])/len(rise_num[1:-1])
b = ax.bar(shares, rise_num, label='{}'.format(means))
for a, b in zip(shares, rise_num):
    ax.text(a, b+1, b, ha='center', va='bottom')

plt.rcParams['font.sans-serif'] = ['SimHei']  # 用来正常显示中文标签
plt.rcParams['axes.unicode_minus'] = False   # 用来正常显示负号
plt.ylabel(f"市场当日涨幅大于{Rise}的股票数量")
plt.title(f"市场当日涨幅大于{Rise}的数量对比")
# 条形图默认宽为0.8,因使用了zip此处不需要矫,xs这条可以不用,所以这里+0.0
xs = [i + 0.0 for i, _ in enumerate(shares)]
# 使名字标记x轴,位置在x轴上条形中心
plt.xticks(xs, shares)
plt.plot(shares, rise_num, 'o')
plt.plot(xs, rise_num, 'k-.')  # 黑色虚线
plt.legend()
# 保存图片
plt.savefig(f'{shares[0]}~{shares[-1]}涨幅大于{Rise}股票数量.png')
plt.show()