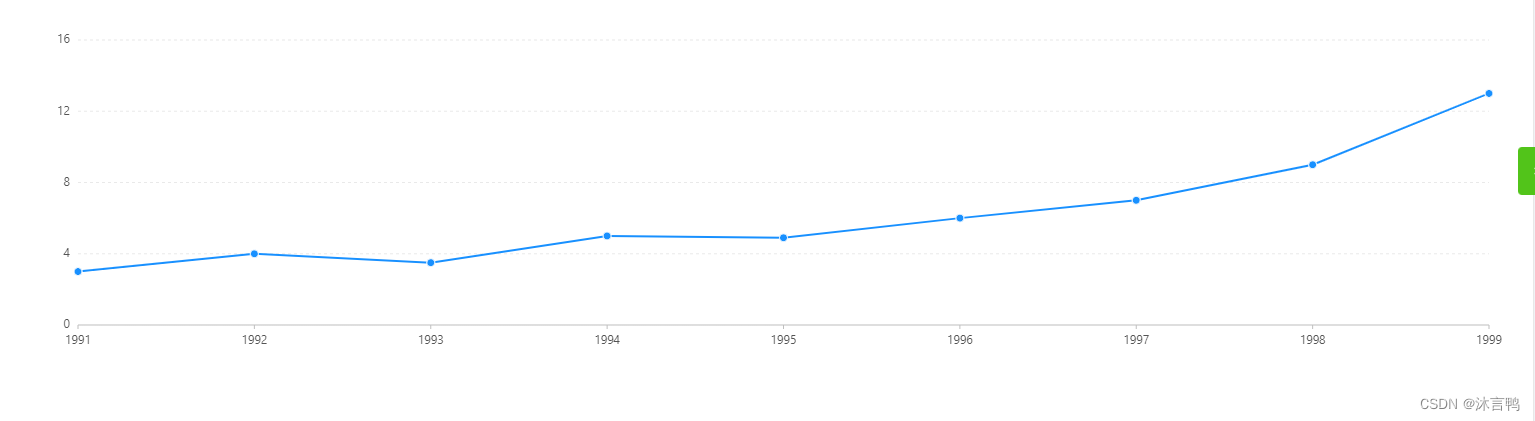
是最基本的折线图了,没有掉用接口,实现效果如下图所示
代码在下:
<template>
  <div>
    <a-card>
      <div id="container" />
    </a-card>
  </div>
</template>
<script>
import G2 from '@antv/g2'
export default {
  mounted () {
    const data = [
      { year: '1991', value: 3 },
      { year: '1992', value: 4 },
      { year: '1993', value: 3.5 },
      { year: '1994', value: 5 },
      { year: '1995', value: 4.9 },
      { year: '1996', value: 6 },
      { year: '1997', value: 7 },
      { year: '1998', value: 9 },
      { year: '1999', value: 13 }
    ];

    const chart = new G2.Chart({
      container: 'container',
      forceFit: true,
      smooth: true,
      height: 400
    });
    chart.source(data);
    chart.scale('value', {
      min: 0
    });
    chart.scale('year', {
      range: [ 0, 1 ]
    });
    chart.tooltip({
      crosshairs: {
        type: 'line'
      }
    });
    chart.line().position('year*value');
    chart.point().position('year*value')
    .size(4)
    .shape('circle')
    .style({
      stroke: '#fff',
      lineWidth: 1
    });
    chart.render();
  }
}
</script>