目录
引言
Simpleperf 是一个Android平台上的一个cpu剖析工具,它可以用来分析app进程和native进程,分析Java和C++代码,simpleperf可执行程序最低运行在L版本,python脚本工具最低运行在N版本。–翻译自googlesource
内容
Simpleperf 目录包含两部分:simpleperf 可执行程序和python脚本。python脚本是对simpleperf的封装和调用,基本操作使用脚本更加简单遍历,本文只关注python脚本的入门使用。(直接使用simpleperf可执行程序也可以,需要手动push到设备中去,然后掌握语法就可以)
安装
方法1,simpleperf包含在ndk中,如果已经安装android studio,可从AS上直接下载安装ndk组件,在sdk下命名为ndk-bundle,也可以单独下载ndk。
方法2,单独下载simpleperf压缩包(可根据ndk版本进行选择)
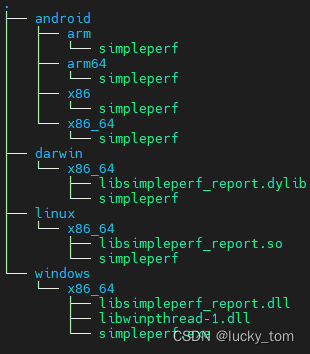
查看下simpleperf根目录
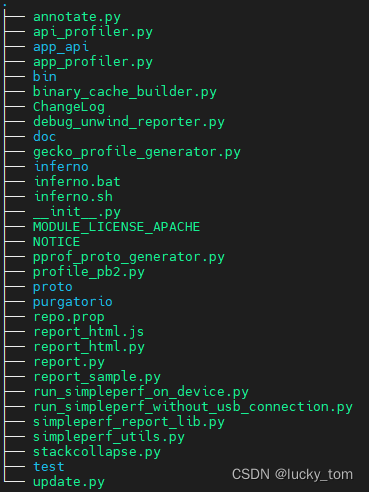
其中,Simpleperf的可执行程序在bin目录下可以看到,不同平台的都提供了,如果只是在windows下,就只需要android和
windows就够了。
采集脚本
我们回头来看看脚本,可以根据他们的功能分为三类:
| 功能 | 脚本 |
|---|---|
| 录制 | app_profiler.py, run_simpleperf_without_usb_connection.py,inferno,run_simpleperf_on_device.py |
| 生成报告 | report.py,report_sample.py |
| 解析数据 | simpleperf_report_lib.py |
那么如何使用呢?看一下官方提供的方法。稍后我们自己实操一下。
app_profiler.py
Record cpu profiling data of an android app or native program.
It downloads simpleperf on device, uses it to collect profiling data on the selected app,
and pulls profiling data and related binaries on host.
查看下使用手册
$ python .\app_profiler.py --help

usage: app_profiler.py [-h]
                       (-p APP | -np NATIVE_PROGRAM | -cmd CMD | --pid PID [PID ...] | --tid TID [TID ...] | --system_wide)
                       [--compile_java_code] [-a ACTIVITY | -t TEST]
                       [-r RECORD_OPTIONS] [-lib NATIVE_LIB_DIR]
                       [-o PERF_DATA_PATH] [-nb] [--ndk_path NDK_PATH]
                       [--disable_adb_root] [--log {

    debug,info,warning}]

app_profiler.py: Record cpu profiling data of an android app or native program.

    It downloads simpleperf on device, uses it to collect profiling data on the selected app,
    and pulls profiling data and related binaries on host.

optional arguments:
  -h, --help            show this help message and exit

Select profiling target:
  -p APP, --app APP     Profile an Android app, given the package name. Like
                        `-p com.example.android.myapp`.
  -np NATIVE_PROGRAM, --native_program NATIVE_PROGRAM
                        Profile a native program running on the Android
                        device. Like `-np surfaceflinger`.
  -cmd CMD              Profile running a command on the Android device. Like
                        `-cmd "pm -l"`.
  --pid PID [PID ...]   Profile native processes running on device given their
                        process ids.
  --tid TID [TID ...]   Profile native threads running on device given their
                        thread ids.
  --system_wide         Profile system wide.

Extra options for profiling an app:
  --compile_java_code   Used with -p. On Android N and Android O, we need to
                        compile Java code into native instructions to profile
                        Java code. Android O also needs wrap.sh in the apk to
                        use the native instructions.
  -a ACTIVITY, --activity ACTIVITY
                        Used with -p. Profile the launch time of an activity
                        in an Android app. The app will be started or
                        restarted to run the activity. Like `-a
                        .MainActivity`.
  -t TEST, --test TEST  Used with -p. Profile the launch time of an
                        instrumentation test in an Android app. The app will
                        be started or restarted to run the instrumentation
                        test. Like `-t test_class_name`.

Select recording options:
  -r RECORD_OPTIONS, --record_options RECORD_OPTIONS
                        Set recording options for `simpleperf record` command.
                        Use `run_simpleperf_on_device.py record -h` to see all
                        accepted options. Default is "-e task-clock:u -f 1000
                        -g --duration 10".
  -lib NATIVE_LIB_DIR, --native_lib_dir NATIVE_LIB_DIR
                        When profiling an Android app containing native
                        libraries, the native libraries are usually stripped
                        and lake of symbols and debug information to provide
                        good profiling result. By using -lib, you tell
                        app_profiler.py the path storing unstripped native
                        libraries, and app_profiler.py will search all shared
                        libraries with suffix .so in the directory. Then the
                        native libraries will be downloaded on device and
                        collected in build_cache.
  -o PERF_DATA_PATH, --perf_data_path PERF_DATA_PATH
                        The path to store profiling data. Default is
                        perf.data.
  -nb, --skip_collect_binaries
                        By default we collect binaries used in profiling data
                        from device to binary_cache directory. It can be used
                        to annotate source code and disassembly. This option
                        skips it.

Other options:
  --ndk_path NDK_PATH   Set the path of a ndk release. app_profiler.py needs
                        some tools in ndk, like readelf.
  --disable_adb_root    Force adb to run in non root mode. By default,
                        app_profiler.py will try to switch to root mode to be
                        able to profile released Android apps.
  --log {

    debug,info,warning}
                        set log level
run_simpleperf_on_device.py
This script pushes the simpleperf executable on the device, and run a simpleperf command on the device. It is more convenient than running adb commands manually.
这个脚本会把simpleperf 可执行程序push到设备上,然后在设备上执行命令,比直接通过adb命令去执行更加方便
点击查看官网举例 - Profile from launch of an application
查看下手册,其实它的subcommands就几乎等于simpleperf的,想查看的同学可以执行下simpleperf -h看下。
$ python .\run_simpleperf_on_device.py -h

Usage: simpleperf [common options] subcommand [args_for_subcommand]
common options:
    -h/--help     Print this help information.
    --log <severity> Set the minimum severity of logging. Possible severities
                     include verbose, debug, warning, info, error, fatal.
                     Default is info.
    --log-to-android-buffer  Write log to android log buffer instead of stderr.
    --version     Print version of simpleperf.
subcommands:
    api-collect         Collect recording data generated by app api
    api-prepare         Prepare recording via app api
    debug-unwind        Debug/test offline unwinding.
    dump                dump perf record file
    help                print help information for simpleperf
    inject              parse etm instruction tracing data
    kmem                collect kernel memory allocation information
    list                list available event types
    record              record sampling info in perf.data
    report              report sampling information in perf.data
    report-sample       report raw sample information in perf.data
    stat                gather performance counter information
    trace-sched         Trace system-wide process runtime events.
run_simpleperf_without_usb_connection.py
run_simpleperf_without_usb_connection.py records profiling data while the USB cable isn‘t connected. Maybe api_profiler.py is more suitable, which also don’t need USB cable when recording. Below is an example.
在不连接USB的情况下,记录数据,可能api_profiler.py更适用,它在记录数据的时候也不需要连接usb
点击查看官网举例 - run_simpleperf_without_usb_connection_py
看下手册
$ python .\run_simpleperf_without_usb_connection.py -h
usage: run_simpleperf_without_usb_connection.py [-h] {

    start,stop} ...

    Support profiling without usb connection in below steps:
    1. With usb connection, start simpleperf recording.
    2. Unplug the usb cable and play the app you want to profile, while the process of
       simpleperf keeps running and collecting samples.
    3. Replug the usb cable, stop simpleperf recording and pull recording file on host.

    Note that recording is stopped once the app is killed. So if you restart the app
    during profiling time, simpleperf only records the first running.

positional arguments:
  {

    start,stop}
    start       Start recording.
    stop        Stop recording.

optional arguments:
  -h, --help    show this help message and exit
根据介绍,大概是说,连接前执行下start,结束录制时,连上usb,执行stop后pull出采集的数据,适用于不连接usb充电的场景。需要注意的是:如果途中app被kill,会自动结束采集数据。
查看报告
上一步我们主要学会怎么执行脚本来采集数据,有了数据就是以哪种形式查看和分析了。官网给出了N多个选择(点击浏览)
先看一个自带的,其他方法还没试过,目的都是以图形化的形式辅助我们分析函数耗时。
report_html.py
report_html.py generates report.html based on the profiling data. Then the report.html can show the profiling result without depending on other files. So it can be shown in local browsers or passed to other machines. Depending on which command-line options are used, the content of the report.html can include: chart statistics, sample table, flamegraphs, annotated source code for each function, annotated disassembly for each function.
转换prof.data 为html报告的形式。其中可包含火焰图。
看下手册
$ python .\report_html.py -h
usage: report_html.py [-h] [-i RECORD_FILE [RECORD_FILE ...]] [-o REPORT_PATH]
                      [--min_func_percent MIN_FUNC_PERCENT]
                      [--min_callchain_percent MIN_CALLCHAIN_PERCENT]
                      [--add_source_code]
                      [--source_dirs SOURCE_DIRS [SOURCE_DIRS ...]]
                      [--add_disassembly]
                      [--binary_filter BINARY_FILTER [BINARY_FILTER ...]]
                      [--ndk_path NDK_PATH] [--no_browser] [--show_art_frames]
                      [--aggregate-by-thread-name]

report profiling data

optional arguments:
  -h, --help            show this help message and exit
  -i RECORD_FILE [RECORD_FILE ...], --record_file RECORD_FILE [RECORD_FILE ...]
                        Set profiling data file to report. Default is
                        perf.data.
  -o REPORT_PATH, --report_path REPORT_PATH
                        Set output html file. Default is report.html.
  --min_func_percent MIN_FUNC_PERCENT
                        Set min percentage of functions shown in the report.
                        For example, when set to 0.01, only functions taking
                        >= 0.01% of total event count are collected in the
                        report. Default is 0.01.
  --min_callchain_percent MIN_CALLCHAIN_PERCENT
                        Set min percentage of callchains shown in the report.
                        It is used to limit nodes shown in the function
                        flamegraph. For example, when set to 0.01, only
                        callchains taking >= 0.01% of the event count of the
                        starting function are collected in the report. Default
                        is 0.01.
  --add_source_code     Add source code.
  --source_dirs SOURCE_DIRS [SOURCE_DIRS ...]
                        Source code directories.
  --add_disassembly     Add disassembled code.
  --binary_filter BINARY_FILTER [BINARY_FILTER ...]
                        Annotate source code and disassembly only for selected
                        binaries.
  --ndk_path NDK_PATH   Find tools in the ndk path.
  --no_browser          Don't open report in browser.
  --show_art_frames     Show frames of internal methods in the ART Java
                        interpreter.
  --aggregate-by-thread-name
                        aggregate samples by thread name instead of thread id.
                        This is useful for showing multiple perf.data
                        generated for the same app.
通过一个例子来观察APP冷启动(以抖音为例)
- 确定下包名和lancherActivity。
PackageName : com.ss.android.ugc.aweme
LancherActivity: com.ss.android.ugc.aweme/.splash.SplashActivity
提前执行一下:adb shell am force-stop com.ss.android.ugc.aweme
- 执行开始监控命令
python .\app_profiler.py -p com.ss.android.ugc.aweme -a com.ss.android.ugc.aweme.splash.SplashActivity -r “-e task-clock:u -f 100 -g --duration 10”
- 上一步完成后会得到一个默认命名为perf.data的文件(可增加-o参数重命名)。继续执行下:
python .\report_html.py
- 完成解析后会得到一个默认命名为report.html的文件(可增加-o参数重命名),一般会自动打开。
火焰图分析
切换到第三个选项卡:Flamegraph(火焰图)
-
每一列代表一个调用栈(栈帧),每一个格子代表一个函数。
-
纵轴代表调用栈的深度,越高代表调用栈越深,下面的方格是上面方格的复函数。
-
横轴代表火焰图将采集的多个调用栈信息,通过按字母横向排序的方式将众多信息聚合在一起。需要注意的是它并不代表时间。
-
火焰图格子的颜色是随机的暖色调。
先确定下主线程,然后搜索下我们熟悉的onCreate方法,匹配到的方法会标识为紫色。
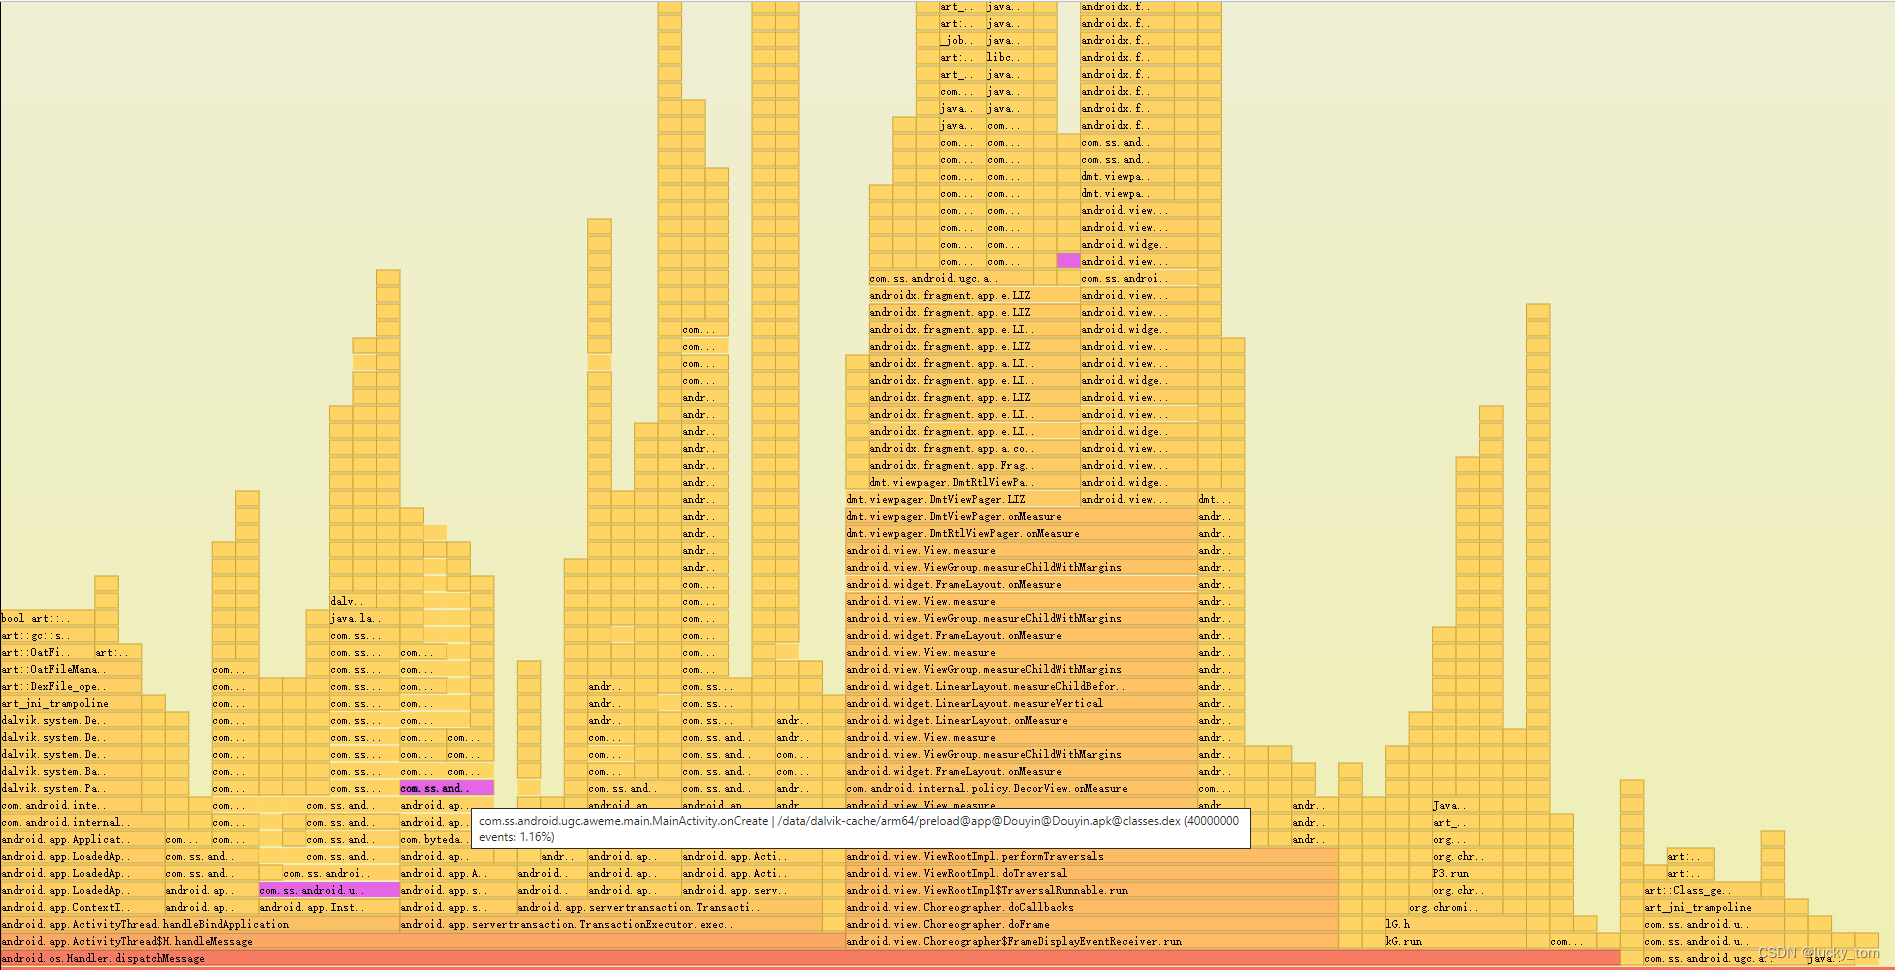
点击函数,可以以这个函数为新的底,以此来跟踪它的子调用。(点击zoom out返回上一级)
分析函数耗时,就是主要看“平顶”函数,耗时越长越能高概率被抽样到,“回回抽查都有你”。
个人理解,函数耗时长进一步分析思路:
- 设计:关注函数自身逻辑是否设计合理,是否有递归?
- 调度:线程优先级是否较低,在大核还是小核被调度?
- 限频:频率是否被限制,可配合trace一起分析。
- 阻塞:是否有阻塞等待,binder调用等待。
- 锁:锁竞争
结束
当前的主要目的是学会Simpleperf的抓取和采集方法,并能识别出一些比较明显的函数耗时问题,其实官网的描述是最全面的,本文也在各个地方插入了超链接方便跳转,如果有想对一些细节或一些其他用法的需要,可以查看官网。
参考
【官网 - Executable commands reference 不借助脚本原始使用Simpleperf】
【官网 - Simpleperf # Android platform profiling 采集系统进程】
【官网 - Simpleperf # Android application profiling 采集应用程序】
【官网 - Simpleperf # Scripts reference 脚本的使用】