% Import all 4.5 million points from a laz file
pc = pointCloud('ALS_strip.laz');

% Plot all points of point cloud
pc.plot('Color'       , 'A.intensity', ... % plot intensity of points
        'ColorMapName', 'gray');           % use gray colomap

title('All Points', 'Color', 'w'); snapnow;

% Select points within all cells with value = 1 of the specified GeoTiff file
path2geoTiff = 'stable_areas.tif';
minMax = [1 1];
pc.select('GeoTiff', path2geoTiff, minMax);

% Plot only the selected points
close; % close previous figure
pc.plot('Color'       , 'A.intensity', ...
        'ColorMapName', 'gray');

title('Points selected with GeoTiff file (= stable areas)', 'Color', 'w');

% Export selected points to ascii file (without attributes)
pc.export('ALS_strip_stable_areas.xyz');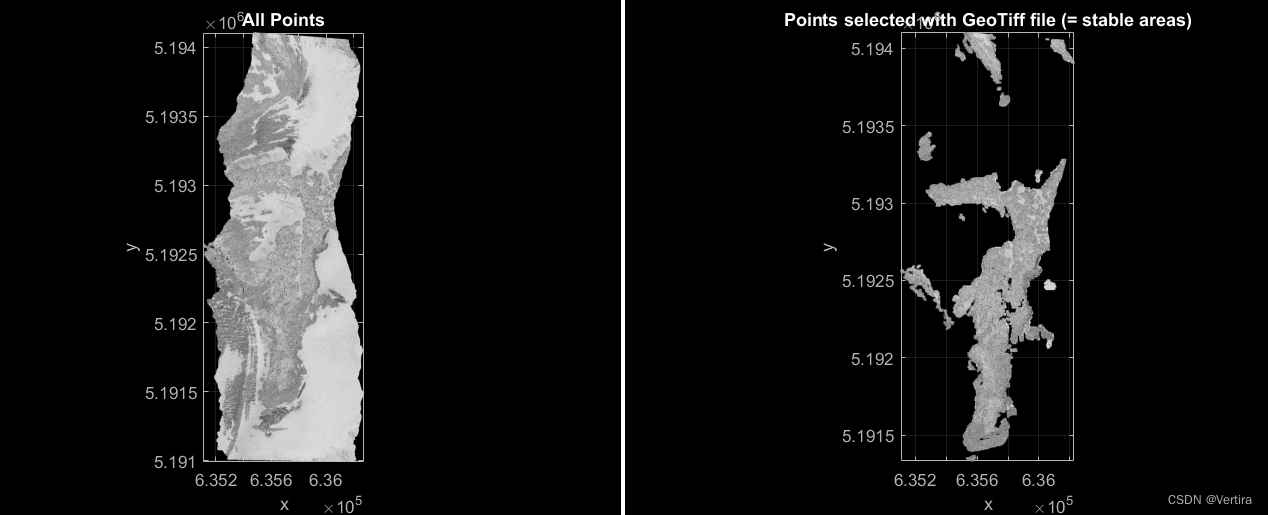
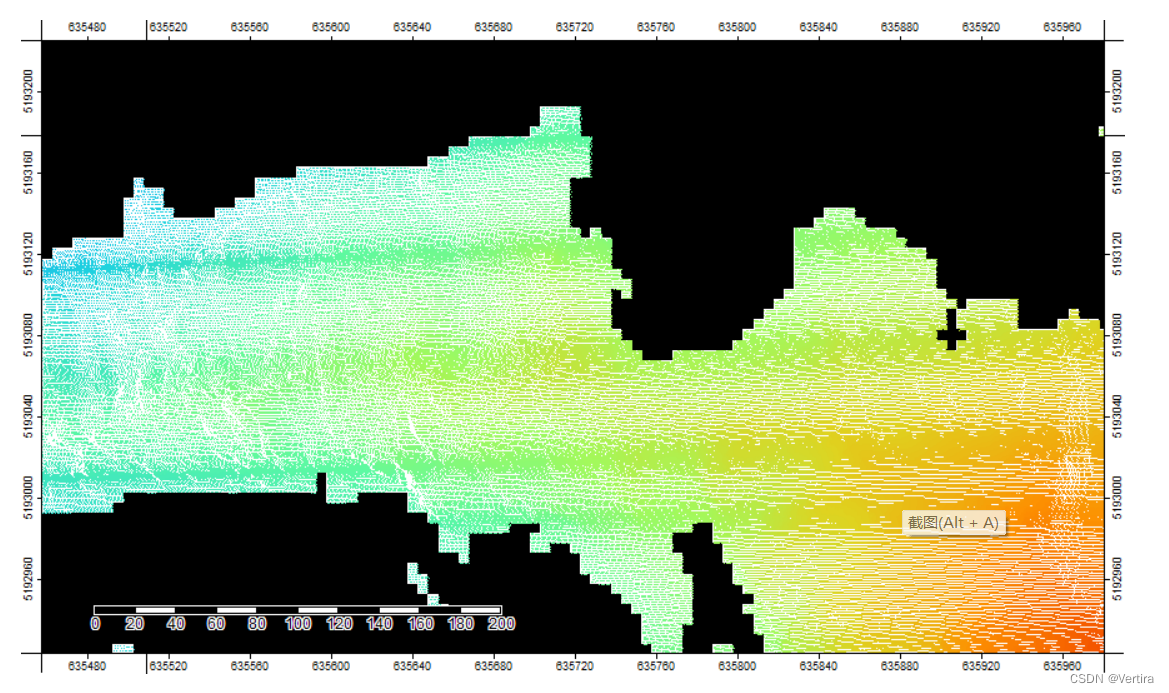
As can be seen in the following image, the points are selected exactly within the white cells (value = 1) of the GeoTiff file (screenshot from SagaGIS).