ALS_strip.laz激光点云数据
(7条消息) 激光点云数据22MB左右-其它文档类资源-CSDN文库![]() https://download.csdn.net/download/Vertira/87718495第一步:可视化一下
https://download.csdn.net/download/Vertira/87718495第一步:可视化一下
% Import all 4.5 million points from a laz file
pc = pointCloud('ALS_strip.laz');

% Plot all points of point cloud
pc.plot('Color'       , 'A.intensity', ... % plot intensity of points
        'ColorMapName', 'gray', ...        % use gray colomap
        'MaxPoints'   , Inf, ...           % maximum number of points is set to infinity, this way all points are visualized!
        'MarkerSize'  , 1);                % small points

title('All points', 'Color', 'w');

% Change camera view
h = gca; h.CameraPosition = [617770 5169400 7300]; h.CameraTarget = [635750 5192420 3200]; h.CameraViewAngle = 0.91;
第二步:过滤(和绘制)点云
% Select points with a sampling distance of 10 meter
pc.select('UniformSampling', 10);

% Plot only the selected points
close; % close previous figure
pc.plot('Color'       , 'A.intensity', ...
        'ColorMapName', 'gray', ...
        'MaxPoints'   , Inf, ...
        'MarkerSize'  , 5);

title('Selected points', 'Color', 'w');

% Change camera view
h = gca; h.CameraPosition = [617770 5169400 7300]; h.CameraTarget = [635750 5192420 3200]; h.CameraViewAngle = 0.91;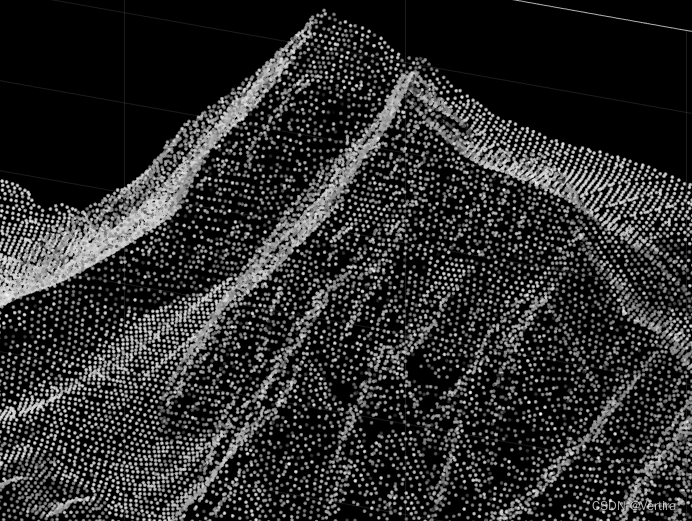
第三步:导出点云 Export point cloud
% Export the selected points only as ply file (without attributes)
pc.export('ALS_strip_selection.ply');