源码基于:Android R
接上一篇博文:《Android crash 流程详解(一):JE》
0. 前言
在上一篇博文剖析了java layer exception 的处理流程,本文将继续剖析 Android crash 的另一部分,即 native 端的 crash,又称 native layer exception (NE) 。
1. begin.S
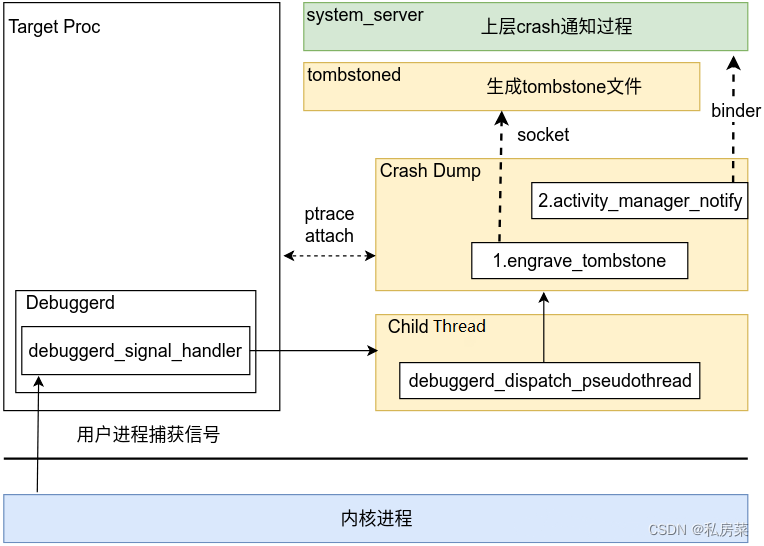
在分析代码之前插入一个 Native 进程装载运行过程的流程图:

大部分动态链接的可执行文件,进入用户空间入口是 linker,linux 上是 ld 动态链接器,android 上 linker;
如图,在一个程序的 main 方法之前还会跑其他的方法,其中 .init 区函数是程序猿可控的,例如写一个全局的变量赋值为 new 一个对象,此时这个对象的初始化就在 .init 区,在main 函数之前执行;
这里是应用程序入口:
bionic/linker/arch/arm64/begin.S

#include <private/bionic_asm.h>

ENTRY(_start)
  // Force unwinds to end in this function.
  .cfi_undefined x30

  mov x0, sp
  bl __linker_init

  /* linker init returns the _entry address in the main image */
  br x0
END(_start)
接着跳转到 __linker_init() 函数:
bionic/linker/linker_main.cpp

extern "C" ElfW(Addr) __linker_init(void* raw_args) {
  ...


  return __linker_init_post_relocation(args, tmp_linker_so);
}
接着调用 __linker_init_post_relocation() 函数:
bionic/linker/linker_main.cpp

static ElfW(Addr) __attribute__((noinline))
__linker_init_post_relocation(KernelArgumentBlock& args, soinfo& tmp_linker_so) {
  ...
  // Initialize the linker's static libc's globals
  __libc_init_globals();

  ...

  ElfW(Addr) start_address = linker_main(args, exe_to_load);

  return start_address;
}
接着调用 linker_main() 函数:
bionic/linker/linker_main.cpp

static ElfW(Addr) linker_main(KernelArgumentBlock& args, const char* exe_to_load) {
  ...

  // Initialize system properties
  __system_properties_init(); // may use 'environ'

  // Register the debuggerd signal handler.
  linker_debuggerd_init();

  ...
}
接着调用 linker_debuggerd_init() 函数:
bionic/linker/linker_debuggerd_android.cpp
void linker_debuggerd_init() {
debuggerd_callbacks_t callbacks = {
.get_abort_message = []() {
return __libc_shared_globals()->abort_msg;
},
.post_dump = ¬ify_gdb_of_libraries,
.get_gwp_asan_state = []() {
return __libc_shared_globals()->gwp_asan_state;
},
.get_gwp_asan_metadata = []() {
return __libc_shared_globals()->gwp_asan_metadata;
},
};
debuggerd_init(&callbacks);
}在该文件中最开始将该函数声明:
#include "debuggerd/handler.h"debuggerd_init() 函数源码定义在 system/core/debuggerd/handler/ 下。
函数最开始定义 debuggerd_callbacks_t 类型的 callbacks,并将其作为参数传入 debuggerd_init() 中。
2. debuggerd_init()
system/core/debuggerd/handler/debuggerd_handler.cpp

void debuggerd_init(debuggerd_callbacks_t* callbacks) {
  if (callbacks) {
    g_callbacks = *callbacks;
  }

  ...

  struct sigaction action;
  memset(&action, 0, sizeof(action));
  sigfillset(&action.sa_mask);
  action.sa_sigaction = debuggerd_signal_handler;
  action.sa_flags = SA_RESTART | SA_SIGINFO;

  // Use the alternate signal stack if available so we can catch stack overflows.
  action.sa_flags |= SA_ONSTACK;
  debuggerd_register_handlers(&action);
}
代码中首先将 callbacks 存入全局变量 g_callbacks 中,接着定义 sigaction 变量。代码上看到最终会通过 sigaction() 设置需要捕捉的 signal,详细可以查看 debuggerd_register_handlers():
system/core/debuggerd/include/debuggerd/handler.h

#define DEBUGGER_SIGNAL BIONIC_SIGNAL_DEBUGGER

static void __attribute__((__unused__)) debuggerd_register_handlers(struct sigaction* action) {
  char value[PROP_VALUE_MAX] = "";
  bool enabled =
      !(__system_property_get("ro.debuggable", value) > 0 && !strcmp(value, "1") &&
        __system_property_get("debug.debuggerd.disable", value) > 0 && !strcmp(value, "1"));
  if (enabled) {
    sigaction(SIGABRT, action, nullptr);
    sigaction(SIGBUS, action, nullptr);
    sigaction(SIGFPE, action, nullptr);
    sigaction(SIGILL, action, nullptr);
    sigaction(SIGSEGV, action, nullptr);
    sigaction(SIGSTKFLT, action, nullptr);
    sigaction(SIGSYS, action, nullptr);
    sigaction(SIGTRAP, action, nullptr);
  }

  sigaction(BIONIC_SIGNAL_DEBUGGER, action, nullptr);
}
当 ro.debuggable 属性或者 debug.debuggerd.disable 没有配置,或配置不为 1 时,enable 为 true,则通过 sigaction() 函数配置需要捕捉的信号。
其中最后会同时捕捉 BIONIC_SIGNAL_DEBUGGER 信号:
bionic/libc/platform/bionic/reserved_signals.h

#define BIONIC_SIGNAL_DEBUGGER (__SIGRTMIN + 3)
回到 debuggerd_init() 函数,在 sigaction 中设置了处理函数 debuggerd_signal_handler(),当 native 进程出现问题的时候,Linux 内核会发出信号,并最终被 debuggerd 捕捉,最后调用 debuggerd_signal_handler() 函数处理。
2.1 debuggerd_signal_handler()
system/core/debuggerd/handler/debuggerd_handler.cpp

static void debuggerd_signal_handler(int signal_number, siginfo_t* info, void* context) {
  ...

  // Only allow one thread to handle a signal at a time.
  int ret = pthread_mutex_lock(&crash_mutex);
  ...

  log_signal_summary(info);

  debugger_thread_info thread_info = {
      .crashing_tid = __gettid(),
      .pseudothread_tid = -1,
      .siginfo = info,
      .ucontext = context,
      .abort_msg = reinterpret_cast<uintptr_t>(abort_message),
      .fdsan_table = reinterpret_cast<uintptr_t>(android_fdsan_get_fd_table()),
      .gwp_asan_state = reinterpret_cast<uintptr_t>(gwp_asan_state),
      .gwp_asan_metadata = reinterpret_cast<uintptr_t>(gwp_asan_metadata),
  };

  ...

  pid_t child_pid =
    clone(debuggerd_dispatch_pseudothread, pseudothread_stack,
          CLONE_THREAD | CLONE_SIGHAND | CLONE_VM | CLONE_CHILD_SETTID | CLONE_CHILD_CLEARTID,
          &thread_info, nullptr, nullptr, &thread_info.pseudothread_tid);
  if (child_pid == -1) {
    fatal_errno("failed to spawn debuggerd dispatch thread");
  }

  // Wait for the child to start...
  futex_wait(&thread_info.pseudothread_tid, -1);

  // and then wait for it to terminate.
  futex_wait(&thread_info.pseudothread_tid, child_pid);

  ...
}- 函数最开始使用互斥锁 pthread_mutex_lock() 来保护线程,方式同一时间多个线程处理信号而导致冲突。
- 接着,调用 log_signal_summary() 来输出一些log 信息信息,例如fault addr、signo、signame、pid、tid、线程名、主线程名等。
- 接着,调用clone() 函数创建伪线程,并在伪线程中调用 debuggerd_dispatch_pseudothread() 函数,原来的线程原地等待子线程的开始和结束。
2.1.1 debuggerd_dispatch_pseudothread()
system/core/debuggerd/handler/debuggerd_handler.cpp

static int debuggerd_dispatch_pseudothread(void* arg) {
  debugger_thread_info* thread_info = static_cast<debugger_thread_info*>(arg);

  for (int i = 0; i < 1024; ++i) {
    // Don't use close to avoid bionic's file descriptor ownership checks.
    syscall(__NR_close, i);
  }

  int devnull = TEMP_FAILURE_RETRY(open("/dev/null", O_RDWR));
  if (devnull == -1) {
    fatal_errno("failed to open /dev/null");
  } else if (devnull != 0) {
    fatal_errno("expected /dev/null fd to be 0, actually %d", devnull);
  }

  // devnull will be 0.
  TEMP_FAILURE_RETRY(dup2(devnull, 1));
  TEMP_FAILURE_RETRY(dup2(devnull, 2));

  unique_fd input_read, input_write;
  unique_fd output_read, output_write;
  if (!Pipe(&input_read, &input_write) != 0 || !Pipe(&output_read, &output_write)) {
    fatal_errno("failed to create pipe");
  }

  // ucontext_t is absurdly large on AArch64, so piece it together manually with writev.
  uint32_t version = 3;
  constexpr size_t expected = sizeof(CrashInfoHeader) + sizeof(CrashInfoDataV3);

  errno = 0;
  if (fcntl(output_write.get(), F_SETPIPE_SZ, expected) < static_cast<int>(expected)) {
    fatal_errno("failed to set pipe buffer size");
  }

  struct iovec iovs[] = {
      {.iov_base = &version, .iov_len = sizeof(version)},
      {.iov_base = thread_info->siginfo, .iov_len = sizeof(siginfo_t)},
      {.iov_base = thread_info->ucontext, .iov_len = sizeof(ucontext_t)},
      {.iov_base = &thread_info->abort_msg, .iov_len = sizeof(uintptr_t)},
      {.iov_base = &thread_info->fdsan_table, .iov_len = sizeof(uintptr_t)},
      {.iov_base = &thread_info->gwp_asan_state, .iov_len = sizeof(uintptr_t)},
      {.iov_base = &thread_info->gwp_asan_metadata, .iov_len = sizeof(uintptr_t)},
  };

  ssize_t rc = TEMP_FAILURE_RETRY(writev(output_write.get(), iovs, arraysize(iovs)));
  if (rc == -1) {
    fatal_errno("failed to write crash info");
  } else if (rc != expected) {
    fatal("failed to write crash info, wrote %zd bytes, expected %zd", rc, expected);
  }

  // Don't use fork(2) to avoid calling pthread_atfork handlers.
  pid_t crash_dump_pid = __fork();
  if (crash_dump_pid == -1) {
    async_safe_format_log(ANDROID_LOG_FATAL, "libc",
                          "failed to fork in debuggerd signal handler: %s", strerror(errno));
  } else if (crash_dump_pid == 0) {
    TEMP_FAILURE_RETRY(dup2(input_write.get(), STDOUT_FILENO));
    TEMP_FAILURE_RETRY(dup2(output_read.get(), STDIN_FILENO));
    input_read.reset();
    input_write.reset();
    output_read.reset();
    output_write.reset();

    raise_caps();

    char main_tid[10];
    char pseudothread_tid[10];
    char debuggerd_dump_type[10];
    async_safe_format_buffer(main_tid, sizeof(main_tid), "%d", thread_info->crashing_tid);
    async_safe_format_buffer(pseudothread_tid, sizeof(pseudothread_tid), "%d",
                             thread_info->pseudothread_tid);
    async_safe_format_buffer(debuggerd_dump_type, sizeof(debuggerd_dump_type), "%d",
                             get_dump_type(thread_info));

    execle(CRASH_DUMP_PATH, CRASH_DUMP_NAME, main_tid, pseudothread_tid, debuggerd_dump_type,
           nullptr, nullptr);
    async_safe_format_log(ANDROID_LOG_FATAL, "libc", "failed to exec crash_dump helper: %s",
                          strerror(errno));
    return 1;
  }

  input_write.reset();
  output_read.reset();

  // crash_dump will ptrace and pause all of our threads, and then write to the pipe to tell
  // us to fork off a process to read memory from.
  char buf[4];
  rc = TEMP_FAILURE_RETRY(read(input_read.get(), &buf, sizeof(buf)));
  if (rc == -1) {
    async_safe_format_log(ANDROID_LOG_FATAL, "libc", "read of IPC pipe failed: %s", strerror(errno));
    return 1;
  } else if (rc == 0) {
    async_safe_format_log(ANDROID_LOG_FATAL, "libc", "crash_dump helper failed to exec");
    return 1;
  } else if (rc != 1) {
    async_safe_format_log(ANDROID_LOG_FATAL, "libc",
                          "read of IPC pipe returned unexpected value: %zd", rc);
    return 1;
  } else if (buf[0] != '\1') {
    async_safe_format_log(ANDROID_LOG_FATAL, "libc", "crash_dump helper reported failure");
    return 1;
  }

  // crash_dump is ptracing us, fork off a copy of our address space for it to use.
  create_vm_process();

  // Don't leave a zombie child.
  int status;
  if (TEMP_FAILURE_RETRY(waitpid(crash_dump_pid, &status, 0)) == -1) {
    async_safe_format_log(ANDROID_LOG_FATAL, "libc", "failed to wait for crash_dump helper: %s",
                          strerror(errno));
  } else if (WIFSTOPPED(status) || WIFSIGNALED(status)) {
    async_safe_format_log(ANDROID_LOG_FATAL, "libc", "crash_dump helper crashed or stopped");
  }

  if (thread_info->siginfo->si_signo != BIONIC_SIGNAL_DEBUGGER) {
    // For crashes, we don't need to minimize pause latency.
    // Wait for the dump to complete before having the process exit, to avoid being murdered by
    // ActivityManager or init.
    TEMP_FAILURE_RETRY(read(input_read, &buf, sizeof(buf)));
  }

  return 0;
}- 该线程中会 fork 一个子进程,并通过 execle() 系统调用去执行 crash_dump64 程序,父进程等待 crash_dump64 进程退出。
- 在 crash_dump64 进程中,再fork 一个新进程,父进程通过 fork_exit_read 去等待子进程,子进程继续执行 crash_dump 的任务。
- 在 crash_dump64 中,通过 /proc/PID/cmdline 获取进程的名字,通过 /proc/PID/fd 获取此进程打开多少文件,每个文件都有一个描述符。
- 在 crash_dump64 中循环遍历这个进程中所有的线程,对进程中的每一个线程进行 ptrace 操作,对目标线程读取器 crashinfo。crashinfo 读取完毕后 detech 当前的线程。
- 之后,在 crash_dump64 中调用 tombstoned_connect() 通过 socket 连接到 tombstoned 进程。根据 signal 的 si_val 的值做不同的判断,为0时 dump tombstone,为1时 dump backtrace。
- 如果是 dump tombstone,最终 tombstone 通过 engrave_tombstone() 函数生成,engrave_tombstone() 函数的第二个参数 unwinder 是输出 backtrace 等信息的关键函数。unwinder 初始化过程中获取了当前进程的内存和 memory map,这些信息会在后面帮助 debuggerd 生成 tombstone 文件。代码如下:
system/core/libunwindstack/Unwinder.cpp

bool UnwinderFromPid::Init(ArchEnum arch) {
  if (pid_ == getpid()) {
    maps_ptr_.reset(new LocalMaps());
  } else {
    maps_ptr_.reset(new RemoteMaps(pid_));
  }
  if (!maps_ptr_->Parse()) {
    return false;
  }
  maps_ = maps_ptr_.get();

  process_memory_ = Memory::CreateProcessMemoryCached(pid_);

  jit_debug_ptr_.reset(new JitDebug(process_memory_));
  jit_debug_ = jit_debug_ptr_.get();
  SetJitDebug(jit_debug_, arch);
#if defined(DEXFILE_SUPPORT)
  dex_files_ptr_.reset(new DexFiles(process_memory_));
  dex_files_ = dex_files_ptr_.get();
  SetDexFiles(dex_files_, arch);
#endif

  return true;
}- 如果 signo 不是 BIONIC_SIGNAL_DEBUGGER,则确认是否需要通知上层,如果crash 进程不是 system_server,则通过 activity_manager_notify() 通知,代码如下:
system/core/debuggerd/crash_dump.cpp

int main(int argc, char** argv) {
  ...

  if (fatal_signal) {
    // Don't try to notify ActivityManager if it just crashed, or we might hang until timeout.
    if (thread_info[target_process].thread_name != "system_server") {
      activity_manager_notify(target_process, signo, amfd_data);
    }
  }
  ...
}
至此,tombstone 生成过程简单分析完成。这里做个小节:
当 Native 进程发生了异常,操作系统会去异常向量表的地址去处理异常,然后发送信号。在debuggred_init() 注册的信号处理函数就会捕获信号并处理,创建伪线程去启动 crash_dump64 进程,crash_dump64 则会获取当前进程中各个线程的 crash 信息。tombstoned 进程是开机就启动的,开机时注册好了 socket 等待连接。当 crash_dump64 去连接 tombstoned 进程的时候,根据传递的 dump_type 类型会返回一个 /data/tombstones/ 下文件描述符。
crash_dump64 进程后续通过 engrave_tombstone() 函数将所有的线程的详细信息写入到 tombstone文件中,至此就在 /data/tombstones/ 下生成了此次对应的 tombstone_XX 文件。详细看第 3 节。
3. engrave_tombstone()
system/core/debuggerd/libdebuggerd/tombstone.cpp

void engrave_tombstone(unique_fd output_fd, unwindstack::Unwinder* unwinder,
                       const std::map<pid_t, ThreadInfo>& threads, pid_t target_thread,
                       uint64_t abort_msg_address, OpenFilesList* open_files,
                       std::string* amfd_data, uintptr_t gwp_asan_state_ptr,
                       uintptr_t gwp_asan_metadata_ptr) {
  // don't copy log messages to tombstone unless this is a dev device
  bool want_logs = android::base::GetBoolProperty("ro.debuggable", false);

  log_t log;
  log.current_tid = target_thread;
  log.crashed_tid = target_thread;
  log.tfd = output_fd.get();
  log.amfd_data = amfd_data;

  _LOG(&log, logtype::HEADER, "*** *** *** *** *** *** *** *** *** *** *** *** *** *** *** ***\n");
  dump_header_info(&log);
  dump_timestamp(&log, time(nullptr));

  auto it = threads.find(target_thread);
  if (it == threads.end()) {
    LOG(FATAL) << "failed to find target thread";
  }

  GwpAsanCrashData gwp_asan_crash_data(unwinder->GetProcessMemory().get(),
                                       gwp_asan_state_ptr,
                                       gwp_asan_metadata_ptr, it->second);

  dump_thread(&log, unwinder, it->second, abort_msg_address, true,
              gwp_asan_crash_data);

  if (want_logs) {
    dump_logs(&log, it->second.pid, 50);
  }

  for (auto& [tid, thread_info] : threads) {
    if (tid == target_thread) {
      continue;
    }

    dump_thread(&log, unwinder, thread_info, 0, false, gwp_asan_crash_data);
  }

  if (open_files) {
    _LOG(&log, logtype::OPEN_FILES, "\nopen files:\n");
    dump_open_files_list(&log, *open_files, "    ");
  }

  if (want_logs) {
    dump_logs(&log, it->second.pid, 0);
  }
}
3.1 header log
在tombstone 文件最开始有个 header log:
*** *** *** *** *** *** *** *** *** *** *** *** *** *** *** ***3.2 header info
接着,调用 dump_header_info() 函数:
system/core/debuggerd/libdebuggerd/tombstone.cpp

static void dump_header_info(log_t* log) {
  auto fingerprint = GetProperty("ro.build.fingerprint", "unknown");
  auto revision = GetProperty("ro.revision", "unknown");

  _LOG(log, logtype::HEADER, "Build fingerprint: '%s'\n", fingerprint.c_str());
  _LOG(log, logtype::HEADER, "Revision: '%s'\n", revision.c_str());
  _LOG(log, logtype::HEADER, "ABI: '%s'\n", ABI_STRING);
}
log 示例如下:
Build fingerprint: 'Schok/SV55216/SV55216:12/SKQ1.220213.001/JSSI_S_V0.2.14.R6-0105-20221028:user/release-keys'
Revision: '0'
ABI: 'arm64'
3.3 dump timestamp
接着,调用 dump_timestamp() 函数:
system/core/debuggerd/libdebuggerd/tombstone.cpp

static void dump_timestamp(log_t* log, time_t time) {
  struct tm tm;
  localtime_r(&time, &tm);

  char buf[strlen("1970-01-01 00:00:00+0830") + 1];
  strftime(buf, sizeof(buf), "%F %T%z", &tm);
  _LOG(log, logtype::HEADER, "Timestamp: %s\n", buf);
}
log 示例如下:
Timestamp: 2022-10-29 04:56:38.808342737+08003.4 dump 线程信息
接着,调用 dump_thread() 函数:
system/core/debuggerd/libdebuggerd/tombstone.cpp

static bool dump_thread(log_t* log, unwindstack::Unwinder* unwinder, const ThreadInfo& thread_info,
                        uint64_t abort_msg_address, bool primary_thread,
                        const GwpAsanCrashData& gwp_asan_crash_data) {
  log->current_tid = thread_info.tid;
  if (!primary_thread) {
    _LOG(log, logtype::THREAD, "--- --- --- --- --- --- --- --- --- --- --- --- --- --- --- ---\n");
  }
  dump_thread_info(log, thread_info);

  if (thread_info.siginfo) {
    dump_signal_info(log, thread_info, unwinder->GetProcessMemory().get());
  }

  if (primary_thread && gwp_asan_crash_data.CrashIsMine()) {
    gwp_asan_crash_data.DumpCause(log);
  } else if (thread_info.siginfo) {
    dump_probable_cause(log, thread_info.siginfo, unwinder->GetMaps(),
                        thread_info.registers.get());
  }

  if (primary_thread) {
    dump_abort_message(log, unwinder->GetProcessMemory().get(), abort_msg_address);
  }

  dump_registers(log, thread_info.registers.get());

  // Unwind will mutate the registers, so make a copy first.
  std::unique_ptr<unwindstack::Regs> regs_copy(thread_info.registers->Clone());
  unwinder->SetRegs(regs_copy.get());
  unwinder->Unwind();
  if (unwinder->NumFrames() == 0) {
    _LOG(log, logtype::THREAD, "Failed to unwind");
  } else {
    _LOG(log, logtype::BACKTRACE, "\nbacktrace:\n");
    log_backtrace(log, unwinder, "    ");
  }

  if (primary_thread) {
    if (gwp_asan_crash_data.HasDeallocationTrace()) {
      gwp_asan_crash_data.DumpDeallocationTrace(log, unwinder);
    }

    if (gwp_asan_crash_data.HasAllocationTrace()) {
      gwp_asan_crash_data.DumpAllocationTrace(log, unwinder);
    }

    unwindstack::Maps* maps = unwinder->GetMaps();
    dump_memory_and_code(log, maps, unwinder->GetProcessMemory().get(),
                         thread_info.registers.get());
    if (maps != nullptr) {
      uint64_t addr = 0;
      siginfo_t* si = thread_info.siginfo;
      if (signal_has_si_addr(si)) {
        addr = reinterpret_cast<uint64_t>(si->si_addr);
      }
      dump_all_maps(log, unwinder, addr);
    }
  }

  log->current_tid = log->crashed_tid;
  return true;
}
第一个函数 dump_thread_info() 主要是打印出错的线程所属的 进程pid、线程tid、线程名、进程名和出错线程对应的apk 的 uid,log 示例如下:
Process uptime: 0s
Cmdline: /system/bin/audioserver
pid: 558, tid: 1570, name: TimeCheckThread  >>> /system/bin/audioserver <<<
uid: 1041
第二个函数 dump_signal_info() 函数打印引发这次 tombstone 的信号信息,调用该函数时会把 thread_info 和进程对应的内存传递给 dump_signal_info(),log 示例如下:
signal 6 (SIGABRT), code -1 (SI_QUEUE), fault addr --------第三个函数 dump_probable_cause(),通过分析 signal_info 打印可能的原因信息,主要依靠分析signal number 和 fault address 来得出可能的结论。如果没有分析出可能的原因就不会打印出任何信息,在本文使用的这个tombstone的例子中就没有任何信息输出。
第四个函数 dump_abort_message(),通过内存信息,确定 abort message,log 示例如下:
Abort message: 'TimeCheck timeout for IAudioFlinger command 2'第五个函数 dump_registers(),打印出错时寄存器的值,thread_info 中记录了错误发生时的寄存器信息,dump_registers() 将它们按顺序输出到 tombstone 文件中,log 示例如下:
    x0  0000000000000000  x1  0000000000000622  x2  0000000000000006  x3  0000007296edb530
    x4  6d686b456e686374  x5  6d686b456e686374  x6  6d686b456e686374  x7  7f7f7f7f7f7f7f7f
    x8  00000000000000f0  x9  000000732f478f98  x10 0000000000000000  x11 ffffff80ffffffdf
    x12 0000000000000001  x13 000000000000002e  x14 0000007296edb6c0  x15 0000000034155555
    x16 000000732f54bd08  x17 000000732f526950  x18 0000007296da2000  x19 000000000000022e
    x20 0000000000000622  x21 00000000ffffffff  x22 b40000729f957c50  x23 b4000072a380a17c
    x24 b4000072a380a17c  x25 0000007296edbcb0  x26 0000007296edbff8  x27 00000000000fc000
    x28 00000000000fe000  x29 0000007296edb5b0
    lr  000000732f4d94e4  sp  0000007296edb510  pc  000000732f4d9514  pst 0000000000001000
第六个函数 log_backtrace(),先在 unwinder 中调用 Unwind()方法解析内存中的信息,然后log_backtrace() 函数中调用了unwinder的 FormatFrame() 函数把获取的堆栈信息输出到tombstone 文件中。调用unwinder的 Unwind() 方法会导致保存的寄存器的值发生变化,所以在调用这个方法之前先对寄存器的值做一个备份。在输出完整backtrace 之前会在 tombstone 文件中输出 backtrace: 关键字,log 示例如下:
backtrace:
      #00 pc 0000000000088514  /apex/com.android.runtime/lib64/bionic/libc.so (abort+168) (BuildId: f0e4842473f8df900c5f1abd6cb10c85)
      #01 pc 00000000000062d4  /system/lib64/liblog.so (__android_log_default_aborter+12) (BuildId: 20c8d97d813ccef68964a5e20eef7405)
      #02 pc 0000000000006de8  /system/lib64/liblog.so (__android_log_assert+308) (BuildId: 20c8d97d813ccef68964a5e20eef7405)
      #03 pc 0000000000034d90  /system/lib64/libmediautils.so (android::TimeCheck::TimeCheckThread::threadLoop()+900) (BuildId: 69bfe95fa028b0b9da00611e5981ad7b)
      #04 pc 0000000000012074  /system/lib64/libutils.so (android::Thread::_threadLoop(void*)+460) (BuildId: 8d27892c6211a1ea345251227a865b7b)
      #05 pc 0000000000011864  /system/lib64/libutils.so (thread_data_t::trampoline(thread_data_t const*)+404) (BuildId: 8d27892c6211a1ea345251227a865b7b)
      #06 pc 00000000000ea310  /apex/com.android.runtime/lib64/bionic/libc.so (__pthread_start(void*)+204) (BuildId: f0e4842473f8df900c5f1abd6cb10c85)
      #07 pc 0000000000089d64  /apex/com.android.runtime/lib64/bionic/libc.so (__start_thread+64) (BuildId: f0e4842473f8df900c5f1abd6cb10c85)
在 tombstone 文件中,会依次输出pc寄存器的值,对应的文件名,对应的函数名和offset。最近的frame中的 pc 寄存器的值可以直接从 thread_info 当中获取,后面的 pc 寄存器的值在 unwind 的过程中更新;后面的文件名可以根据 memory map 和 pc 寄存器中的地址得出;后面的function name 和 function offset 是通过 memory map 和 pc寄存器中的地址找到dex文件,解析dex文件可以得到对应的函数名和offset。
第七个函数 dump_memory_and_code(),这个函数只在主线程中调用,它通过 regs->IterateRegisters() 循环遍历每一个寄存器,打印寄存器附近的memory 信息。dump_memory_and_code() 中主要是获取寄存器名和值,还有 map_info 的 name 属性编辑到label 中,真正进行 dump 的部分在 dump_memory() 函数里。dump_memory() 函数中从寄存器记录的地址 addr 的位置读取了 256个byte 的内存到 data 中,并输出到 tombstone 文件,每 16 个bytes 一行,输出了 16 行,输出的:
- 第一段是对应的起始地址
- 第二第三段是内存的值,每一个 byte 用两个16进制数表示
- 第四段是对应的ascii码。
log 示例如下:
memory near x3 ([anon:stack_and_tls:1570]):
    0000007296edb510 0000007296edb570 0000007296edbfb0  p...r.......r...
    0000007296edb520 0000007296edb5b0 0000007335091718  ....r......5s...
    0000007296edb530 0000000000000000 00000000ffffffff  ................
    0000007296edb540 000004110000022e 0000000000000000  ................
    0000007296edb550 0000000000000000 0000000000000000  ................
    0000007296edb560 0000000000000000 0000000000000000  ................
    0000007296edb570 0000000000000000 0000000000000000  ................
    0000007296edb580 0000000000000000 0000000000000000  ................
    0000007296edb590 0000000000000000 0000000000000000  ................
    0000007296edb5a0 0000000000000000 0000000000000000  ................
    0000007296edb5b0 0000007296edb5e0 00000073350912d8  ....r......5s...
    0000007296edb5c0 0000000000000000 ffffffffffffffdf  ................
    0000007296edb5d0 000000733508dea0 000000732b039db1  ...5s......+s...
    0000007296edb5e0 0000007296edbae0 0000007335091dec  ....r......5s...
    0000007296edb5f0 02c86ff2635c4206 0000000000000000  .B\c.o..........
0000007296edb600 73626d6f7420676e 726f6620656e6f74 ng tombstone for第八个函数是 dump_all_maps() 用以打印maps 信息,dump_threads()向dump_all_maps()传入unwinder和信号的对应地址,和dump_memroy_and_code() 一样,dump_all_maps() 只在主线程中被调用。Map信息在 unwinder 初始化的时候获取,map 信息记录了进程对应的内存映射,包括开始地址,长度,访问权限,文件描述符,offset 等信息。
从 tombstone实例中可以看到输出的信息依次为内存的起始和结束位置,对内存的操作权限,内存的offset,内存的长度,map的名字和buildID,log 示例如下:
memory map (843 entries):
    00000063'a6102000-00000063'a6102fff r--         0      1000  /system/bin/audioserver (BuildId: e51a7b7a832024c9f925efe68cdf6760)
    00000063'a6103000-00000063'a6104fff r-x      1000      2000  /system/bin/audioserver (BuildId: e51a7b7a832024c9f925efe68cdf6760)
    00000063'a6105000-00000063'a6105fff r--      3000      1000  /system/bin/audioserver (BuildId: e51a7b7a832024c9f925efe68cdf6760)
    00000072'81078000-00000072'81e33fff ---         0    dbc000

    ...

    00000072'a1d4c000-00000072'a1d58fff r--         0      d000  /system/lib64/[email protected] (BuildId: e3bd4213dd1b72f039003aea54c6607f)
    00000072'a1d59000-00000072'a1d65fff r-x      d000      d000  /system/lib64/[email protected] (BuildId: e3bd4213dd1b72f039003aea54c6607f)
    00000072'a1d66000-00000072'a1d68fff r--     1a000      3000  /system/lib64/[email protected] (BuildId: e3bd4213dd1b72f039003aea54c6607f)
    00000072'a1d69000-00000072'a1d69fff rw-     1c000      1000  /system/lib64/[email protected] (BuildId: e3bd4213dd1b72f039003aea54c6607f)

    ...

    00000073'36ec6000-00000073'36ec9fff r-x      6000      4000  /system/lib64/android.hardware.power-V2-cpp.so (BuildId: f133fa01073cf14b71366ac9f296d6df)
    00000073'36eca000-00000073'36ecbfff r--      a000      2000  /system/lib64/android.hardware.power-V2-cpp.so (BuildId: f133fa01073cf14b71366ac9f296d6df)
    00000073'36ecc000-00000073'36ecdfff rw-      b000      2000  /system/lib64/android.hardware.power-V2-cpp.so (BuildId: f133fa01073cf14b71366ac9f296d6df)
    00000073'36f1b000-00000073'36f46fff r--         0     2c000  /system/lib64/libcamera_client.so (BuildId: 66be4adcd38635ccb9eba9c268ddc0f1)
    00000073'36f47000-00000073'36f8efff r-x     2c000     48000  /[[TRUNCATED]]
至此,dump_thread() 函数简单剖析完成。
3.5 dump_open_files_list()
该函数执行需要形参 open_files 不为空,该值是在 crash_dump 中传入,在 crash_dump 中函数最开始 通过 populate_open_files_list() 收集目标线程打开的文件,如果最终 open_files 为null,则不会调用 dump_open_files_list() 函数。
3.6 dump_logs()
system/core/debuggerd/libdebuggerd/tombstone.cpp

static void dump_logs(log_t* log, pid_t pid, unsigned int tail) {
  if (pid == getpid()) {
    // Cowardly refuse to dump logs while we're running in-process.
    return;
  }

  dump_log_file(log, pid, "system", tail);
  dump_log_file(log, pid, "main", tail);
}
dump system logs 和 main logs。
至此,engrave_tombstone() 函数简单剖析完成,后续会继续补充细节。
4. tombstone 文件分析
根据pid 和 tid 确认所属进程和线程,如果 pid 和 tid 相同,则 crash 发生在这个进程的主线程中;
根据 name 判断crash 所属线程名,以及该线程所属进程;
根据 signal 确认程序因为收到什么信号导致 crash 及错误地址;

根据 backtrace 分析crash 出错的具体位置。可以通过 addr2line 工具分析backtrace,根据backtrace 提供的内存地址和符号库文件去确定代码出错的具体位置。在backtrace 中越靠上就越接近最后被调用的函数。需要注意的是只有带 symbol 的so 文件才能通过 addr2line 定位。另一个可以解读 tombstone 文件的工具是 objdump,可以反汇编指定 so 文件来得到对应的源代码和汇编代码。
参考:
https://blog.csdn.net/feelabclihu/article/details/113011145
https://blog.csdn.net/TaylorPotter/article/details/103779294
https://blog.csdn.net/TaylorPotter/article/details/103785967
https://blog.csdn.net/TaylorPotter/article/details/86522986