平行趋势检验有很多方法,这里选用我能够理解的方法。
step1
(1)我们需要用各期时间减去各自政策开始实施时间,生成一个相对的时间值
event(各期时间相对于政策时点前后期数),然后根据需要,对实施新政较晚的个体进行政策前的截尾处理,对实施新政较早的个体进行政策后的截尾处理。gen event = year - birth_year
year为当年时间,birth_year为政策实施时间。
step2
(2)根据政策时点前后期数
event,生成表示政策时点前后各期的虚拟变量pre5-pre1、current、post1-post3forvalues i=5(-1)1{ gen pre`i'=(event==-`i'& quota==1) } gen current=(event==0 & quota==1) forvalues i=1(1)3{ gen post`i'=(event==`i'& quota==1) }
i=5(-1)1表示从i=5开始一直减一知道i=1
step3
drop pre_1
xtreg y  pre_* current  post_* size i.year, fe r
保存输出结果到word参考Stata输出统计结果到Excel或word-CSDN博客
结果
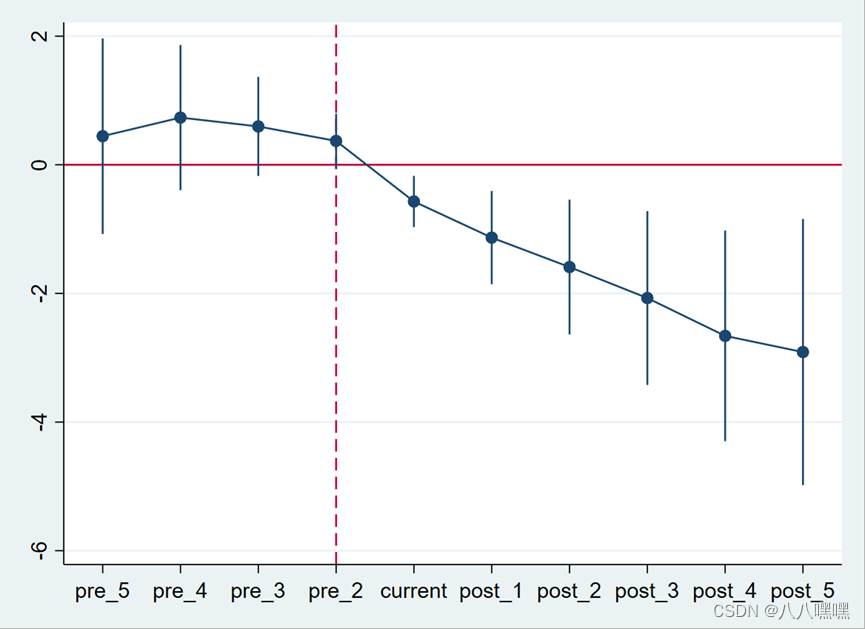
coefplot, baselevels ///
keep(pre* current post*) ///
vertical ///转置图形
coeflabels(pre4=-4 pre3=-3 pre2=-2 pre1=-1 ///
current=0 post1=1 post2=2 post3=3 post4=4) ///
yline(0,lwidth(vthin) lpattern(solid) lcolor(teal)) ///
xline(5,lwidth(vthin) lpattern(solid) lcolor(teal)) ///
ylabel(-1(2)9,labsize(*0.85) angle(0)) xlabel(,labsize(*0.85)) ///
ytitle("Coefficients") ///
msymbol(O) msize(small) mcolor(gs1) ///plot样式
addplot(line @b @at,lcolor(gs1) lwidth(medthick)) ///增加点之间的连线
ciopts(recast(rline) lwidth(thin) lpattern(dash) lcolor(gs2)) ///置信区间样式
graphregion(color(white)) //白底
发现结果中不仅政策实施前不显著异于0,实施后也不显著异于0.
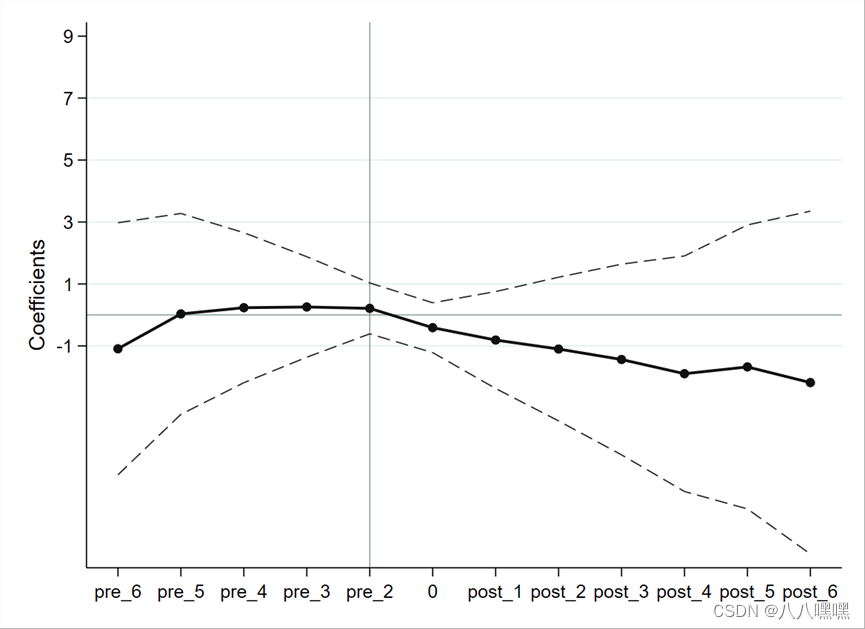
前后缩尾5后满足要求
est sto reg
coefplot reg,keep(pre_* current time_*) vertical recast(connect) yline(0) xline(4,lp(dash))///
ytitle("政策效应") ///
xtitle("时期 (pre_*政策前,current政策年,time_*政策后)")