根据现有身高和体重训练模型,再对测试集做出判断
一.根据现有数据创建标签
- #对数据集进行预处理
- import random
- def calc_bmi(h, w):
- bmi = w / (h/100) ** 2
- if bmi < 18.5: return "thin"
- if bmi < 25.0: return "normal"
- return "fat"
- #bim值小于18.5是瘦,小于25.0是普通,否侧是胖
- fp = open("./data/bmi.csv","w",encoding="utf-8")
- fp.write("height,weight,label\r\n")
- cnt = {"thin":0, "normal":0, "fat":0}
- for i in range(20000):
- h = random.randint(120,200)
- w = random.randint(35, 80)
- label = calc_bmi(h, w)
- cnt[label] += 1
- fp.write("{0},{1},{2}\r\n".format(h, w, label))
- fp.close()
- print("ok,", cnt)
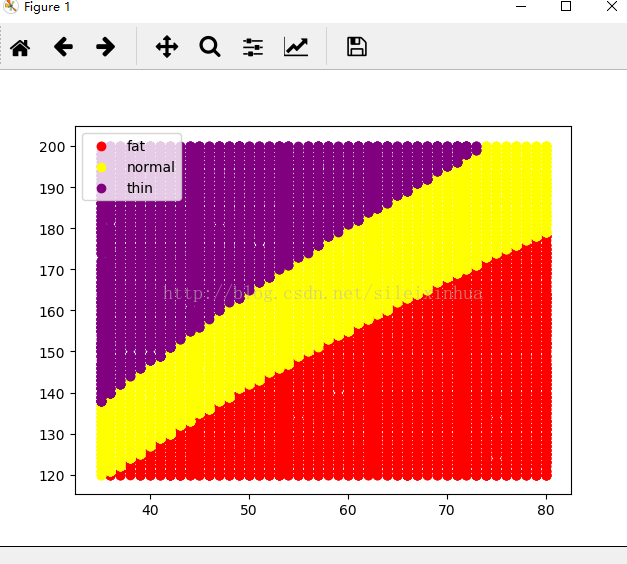
二.数据信息可视化绘图
- #绘制三种不同类型的数据分布
- import matplotlib.pyplot as plt
- import pandas as pd
- tbl = pd.read_csv("./data/bmi.csv", index_col=2)
- #读取数据
- fig = plt.figure()
- ax = fig.add_subplot(1, 1, 1)
- #三种子图重叠
- def scatter(lbl, color):
- b = tbl.loc[lbl]
- ax.scatter(b["weight"],b["height"], c=color, label=lbl)
- scatter("fat", "red")
- scatter("normal", "yellow")
- scatter("thin", "purple")
- #设置不同属性颜色
- ax.legend()
- plt.show()
- #显示图像
运行结果
三.运用sklearn中的SVM的SVC训练数据并预测结果
- #用sklearn的SVC方法来训练数据集,并交叉验证预测精度
- from sklearn import cross_validation, svm, metrics
- import matplotlib.pyplot as plt
- import pandas as pd
- tbl = pd.read_csv("./data/bmi.csv")
- #读取数据
- label = tbl["label"]
- #读取数据中的标签列
- w = tbl["weight"] / 100
- h = tbl["height"] / 200
- wh = pd.concat([w, h], axis=1)
- data_train, data_test, label_train, label_test = cross_validation.train_test_split(wh, label)
- #将数据分成两组数据集和测试集
- clf = svm.SVC()
- clf.fit(data_train, label_train)
- #训练数据
- predict = clf.predict(data_test)
- #预测数据
- ac_score = metrics.accuracy_score(label_test, predict)
- #生成测试精度
- cl_report = metrics.classification_report(label_test, predict)
- #生成交叉验证的报告
- print(ac_score)
- #显示数据精度
- print(cl_report)
- #显示交叉验证数据集报告
运行结果
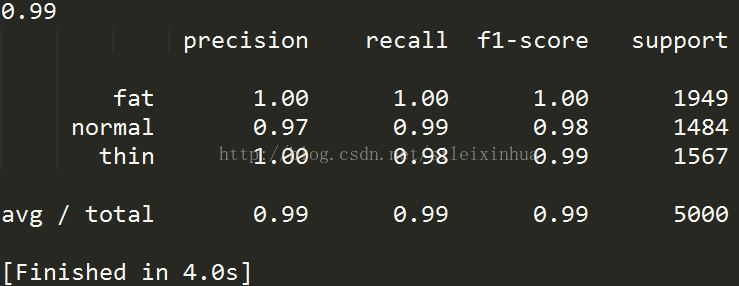
交叉验证三组测试集平均预测精度为0.99
四.运用sklearn中的SVM的linearSVC训练数据并预测结果
- #用sklearn的LinearSVC方法来训练数据集,并交叉验证预测精度
- from sklearn import cross_validation, svm, metrics
- import matplotlib.pyplot as plt
- import pandas as pd
- tbl = pd.read_csv("./data/bmi.csv")
- #读取数据
- label = tbl["label"]
- #读取数据中的标签列
- w = tbl["weight"] / 100
- h = tbl["height"] / 200
- wh = pd.concat([w, h], axis=1)
- data_train, data_test, label_train, label_test = cross_validation.train_test_split(wh,label)
- #将数据分成两组数据集和测试集
- clf = svm.LinearSVC()
- clf.fit(data_train, label_train)
- #训练数据
- predict = clf.predict(data_test)
- #预测数据
- ac_score = metrics.accuracy_score(label_test, predict)
- #生成测试精度
- cl_report = metrics.classification_report(label_test, predict)
- #生成交叉验证的报告
- print(ac_score)
- #显示数据精度
- print(cl_report)
- #显示交叉验证数据集报告
运行结果
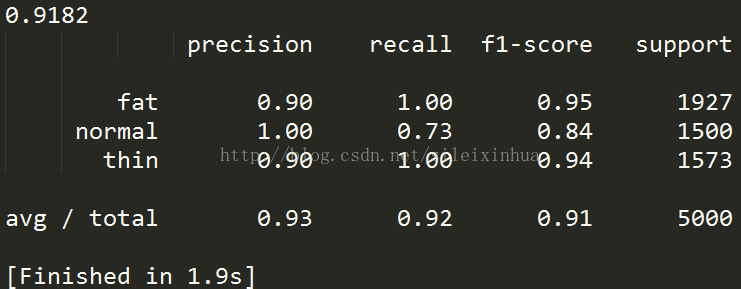
交叉验证三组测试集平均预测精度为0.9182