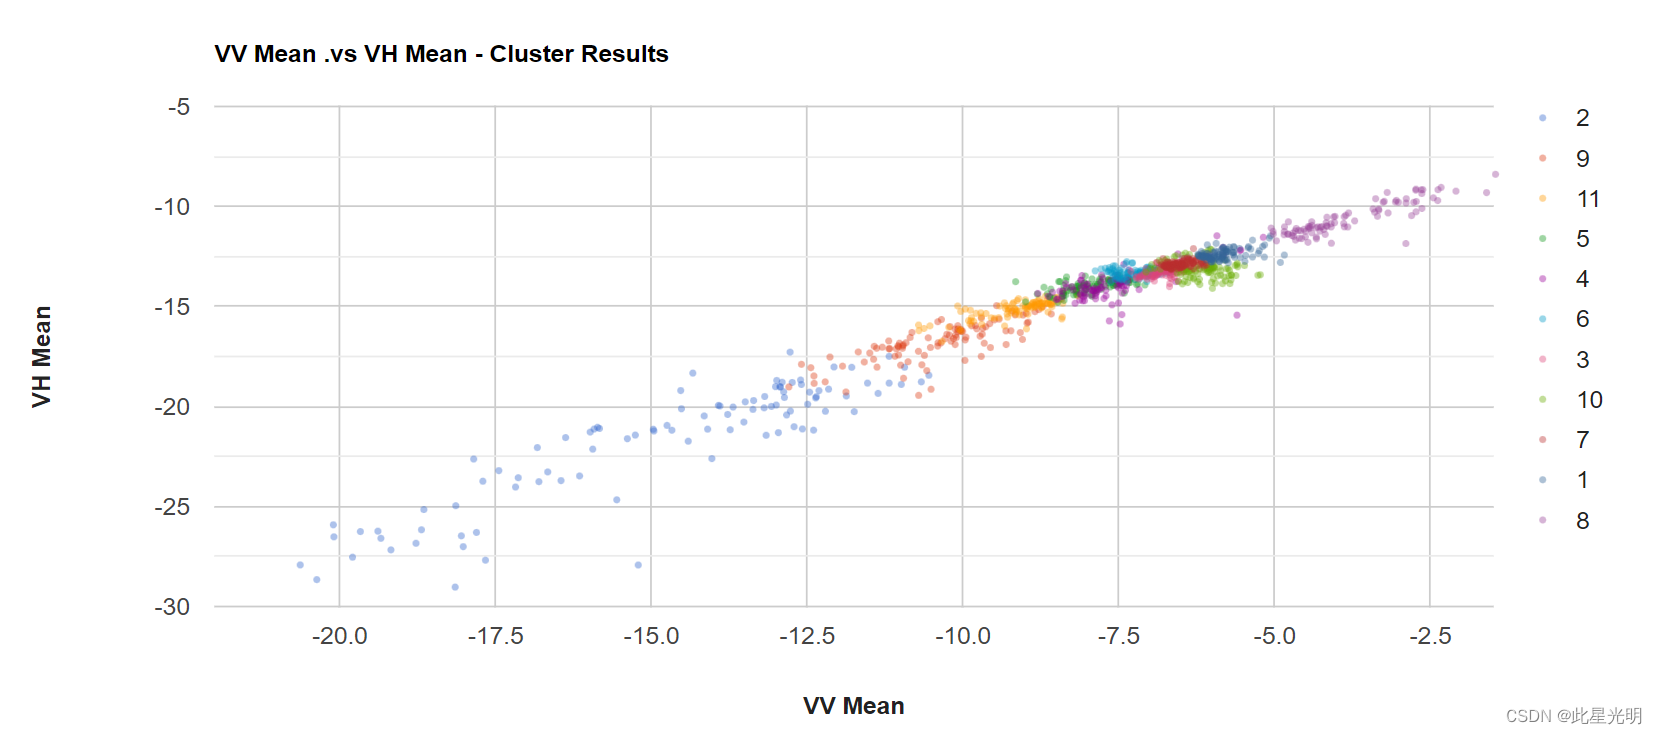
这里我们使用散点图,通过建立函数来构建一个散点图。
函数:
ui.Chart.feature.groups(features, xProperty, yProperty, seriesProperty)
Generates a Chart from a set of features. Plots the value of a given property across groups of features. Features with the same value of groupProperty will be grouped and plotted as a single series.
-
X-axis = xProperty values.
-
Y-axis = yProperty values.
-
Series = Feature groups, by seriesProperty.
Returns a chart.
Arguments:
features (Feature|FeatureCollection|List<Feature>):
The features to include in the chart.
xProperty (String):