前言
使用Pandas读取excel文件,提取并处理数据;使用Matplotlib进行数据可视化,练习区域划分与图表完善。
1.区域划分练习
(1)引入库
import pandas as pd
import matplotlib.pyplot as plt
from math import ceil#向上取整
(2)设置文件路径、所提取的内容、展示形式
f_path = './data/test.xls'#文件位置
p_path = './data/test'#图片位置
sheets = ['Data']#工作表
labels = ['TimeOutput', 'I']#数据列
append_num = 18#工作表数目
for i in range(append_num):
    sheets.append('Append'+str(i+1))
col = 4#列数
row = ceil(len(sheets)/4)#行数
fig = plt.figure(figsize=(12, 6))#创建图表
(3)循环读取并处理数据,绘图
for i, sheet in enumerate(sheets):
    #读取数据
    print('{}/{}'.format(i+1,append_num+1),sheet)
    d = pd.read_excel(f_path, sheet_name=sheet, header=0, usecols=labels)
    x = d[labels[0]]
    y = d[labels[1]]
    #绘图
    ax = fig.add_subplot(row, col, i+1)#添加区域
    ax.plot(x, y, 'b-')
    ax.set_title(sheet)
    ax.set_xlabel(labels[0])
    ax.set_ylabel(labels[1])
(4)保存并展示图片
plt.tight_layout()#调整间距
plt.savefig(p_path, dpi=600)
plt.show()
(5)结果展示
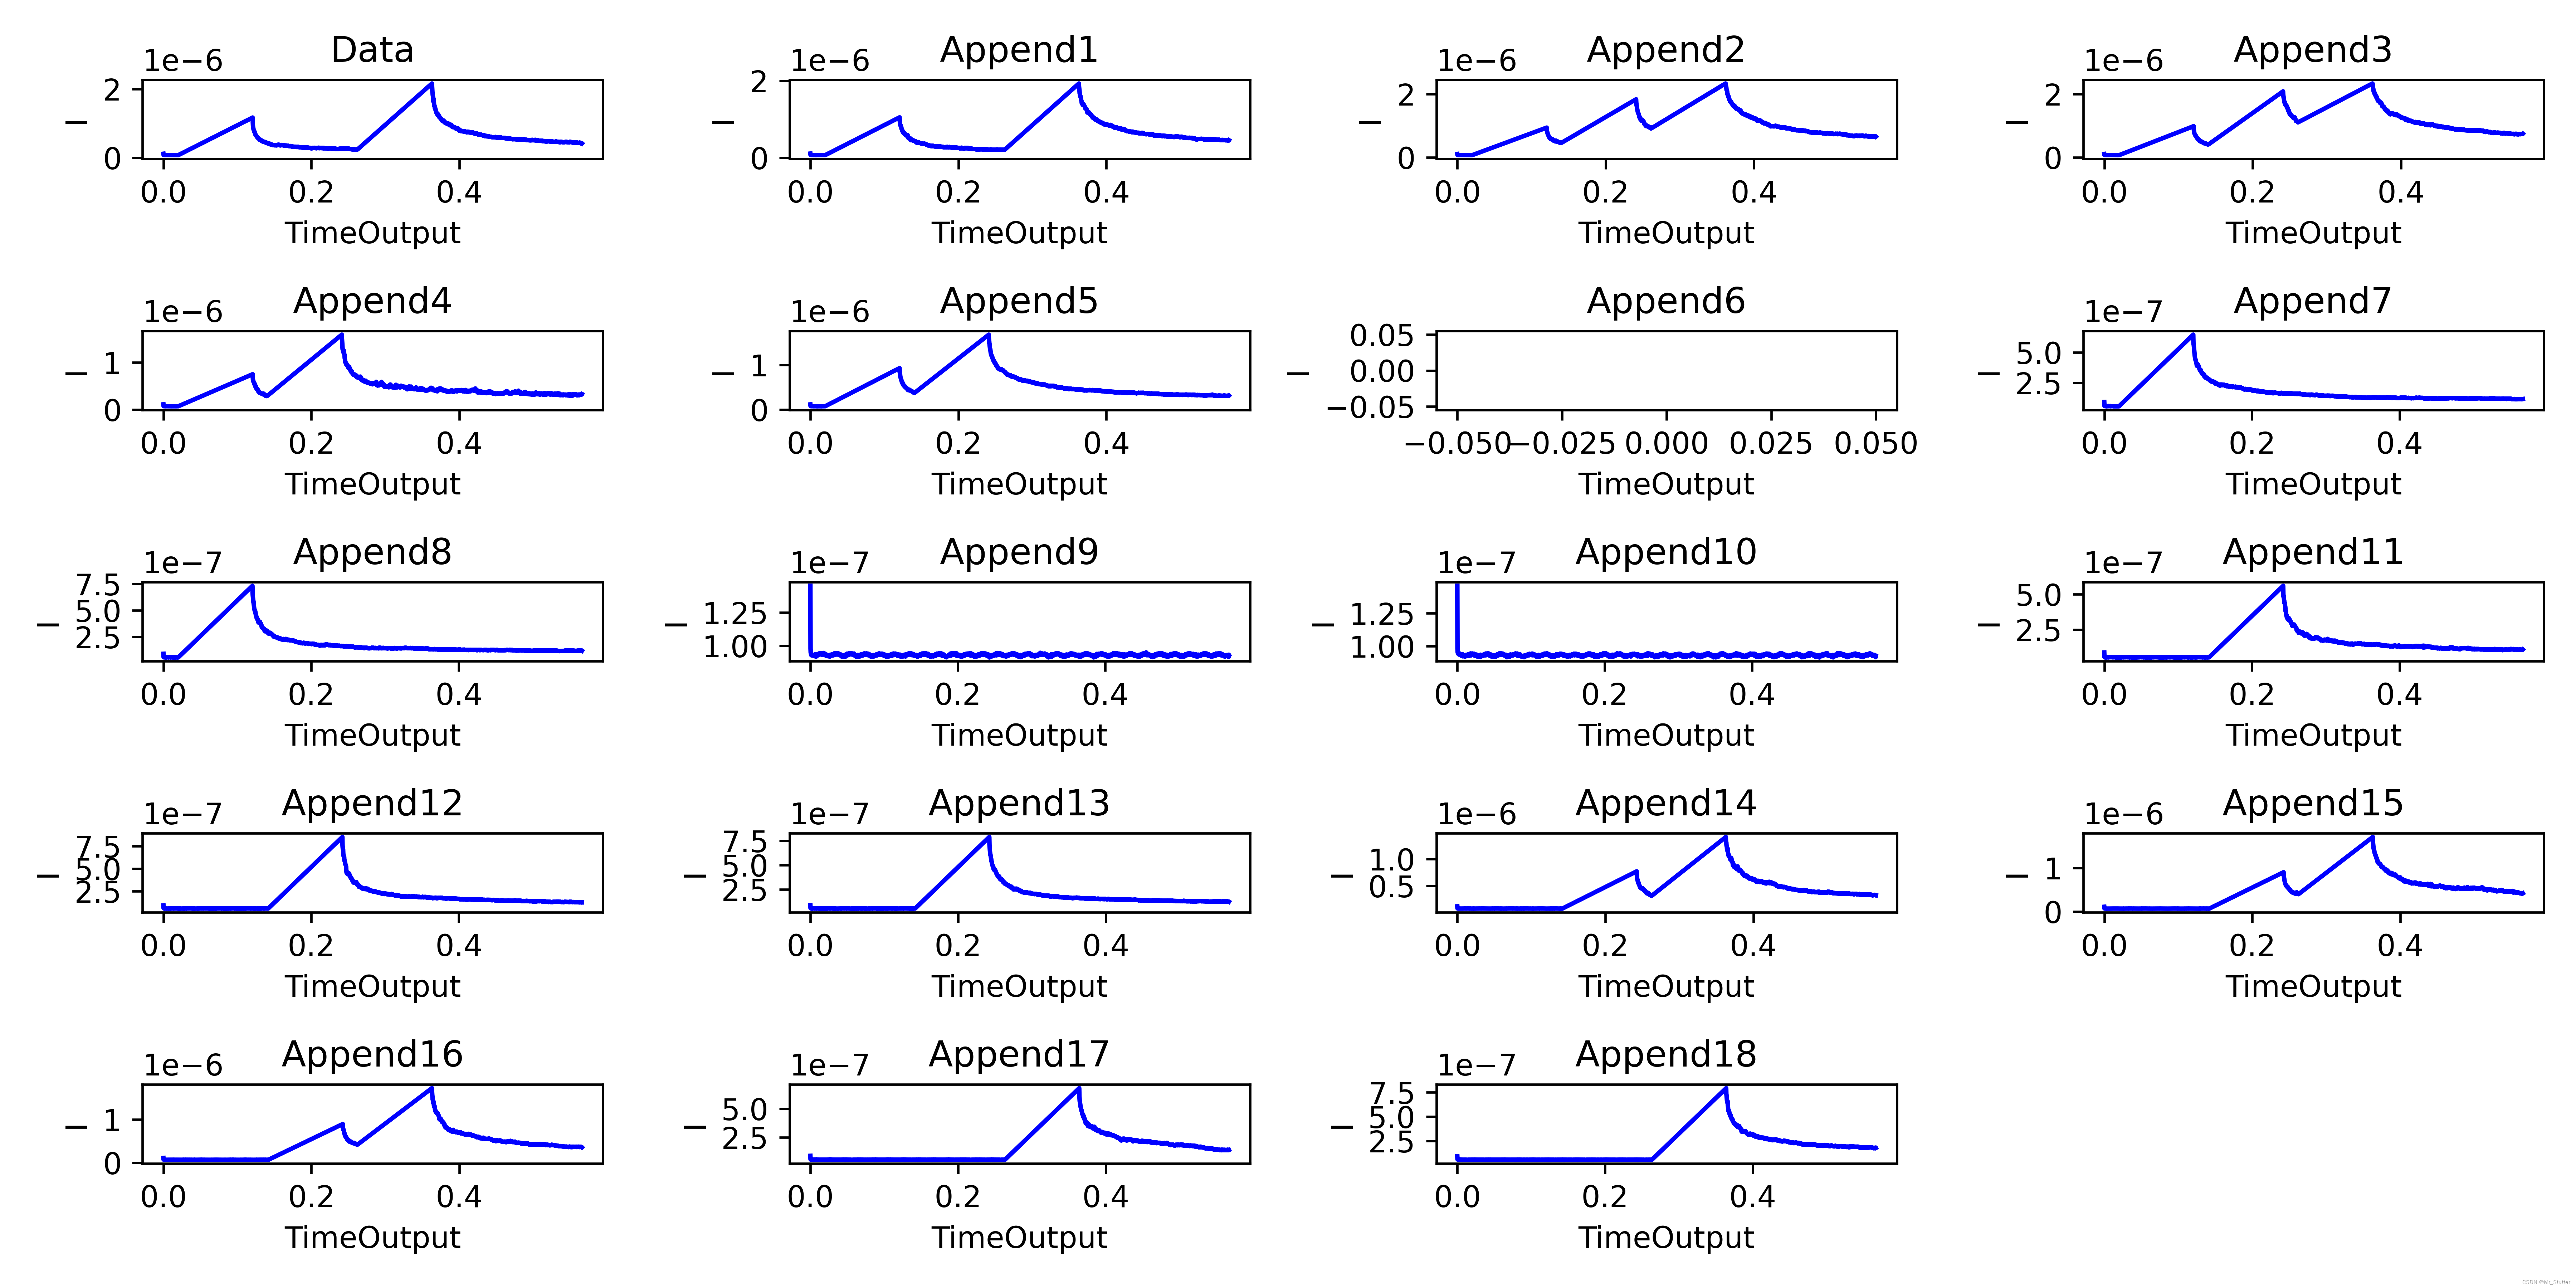
2.图表完善练习
(1)引入库
import pandas as pd
import matplotlib.pyplot as plt
(2)设置文件路径、所需提取的数据、图例与添加的文本
f_path = './data/test.xls'#文件位置
p_path = './data/test0'#图片位置
sheet = 'Data'#工作表
cols = ['TimeOutput', 'I']#数据列
labels = ['Time(s)', 'Current(μA)']#坐标轴
lgd = '1-0-1'#图例
text = 'WRITE:-3V,100ms\nREAD:-0.6V,200μs'#文本
(3)读取并处理数据
#读取数据
d = pd.read_excel(f_path, sheet_name=sheet, header=0, usecols=cols)
x = d[cols[0]]
y = d[cols[1]]
#数据处理
y = y*10**6
(4)绘图,完善图表
#绘图
fig = plt.figure()
ax = fig.add_subplot()
ax.plot(x, y, 'b-')
plt.rcParams['xtick.direction'] = 'in'#刻度线向内
plt.rcParams['ytick.direction'] = 'in'
ax.set_xlabel(labels[0])#坐标轴
ax.set_ylabel(labels[1])
ax.legend([lgd], fontsize=10, loc='upper right', frameon=False)#图例
ax.text(0.05, 0.85, text, fontsize=10, transform=ax.transAxes)#文本
plt.savefig(p_path, dpi=600)
plt.show()
(5)结果展示
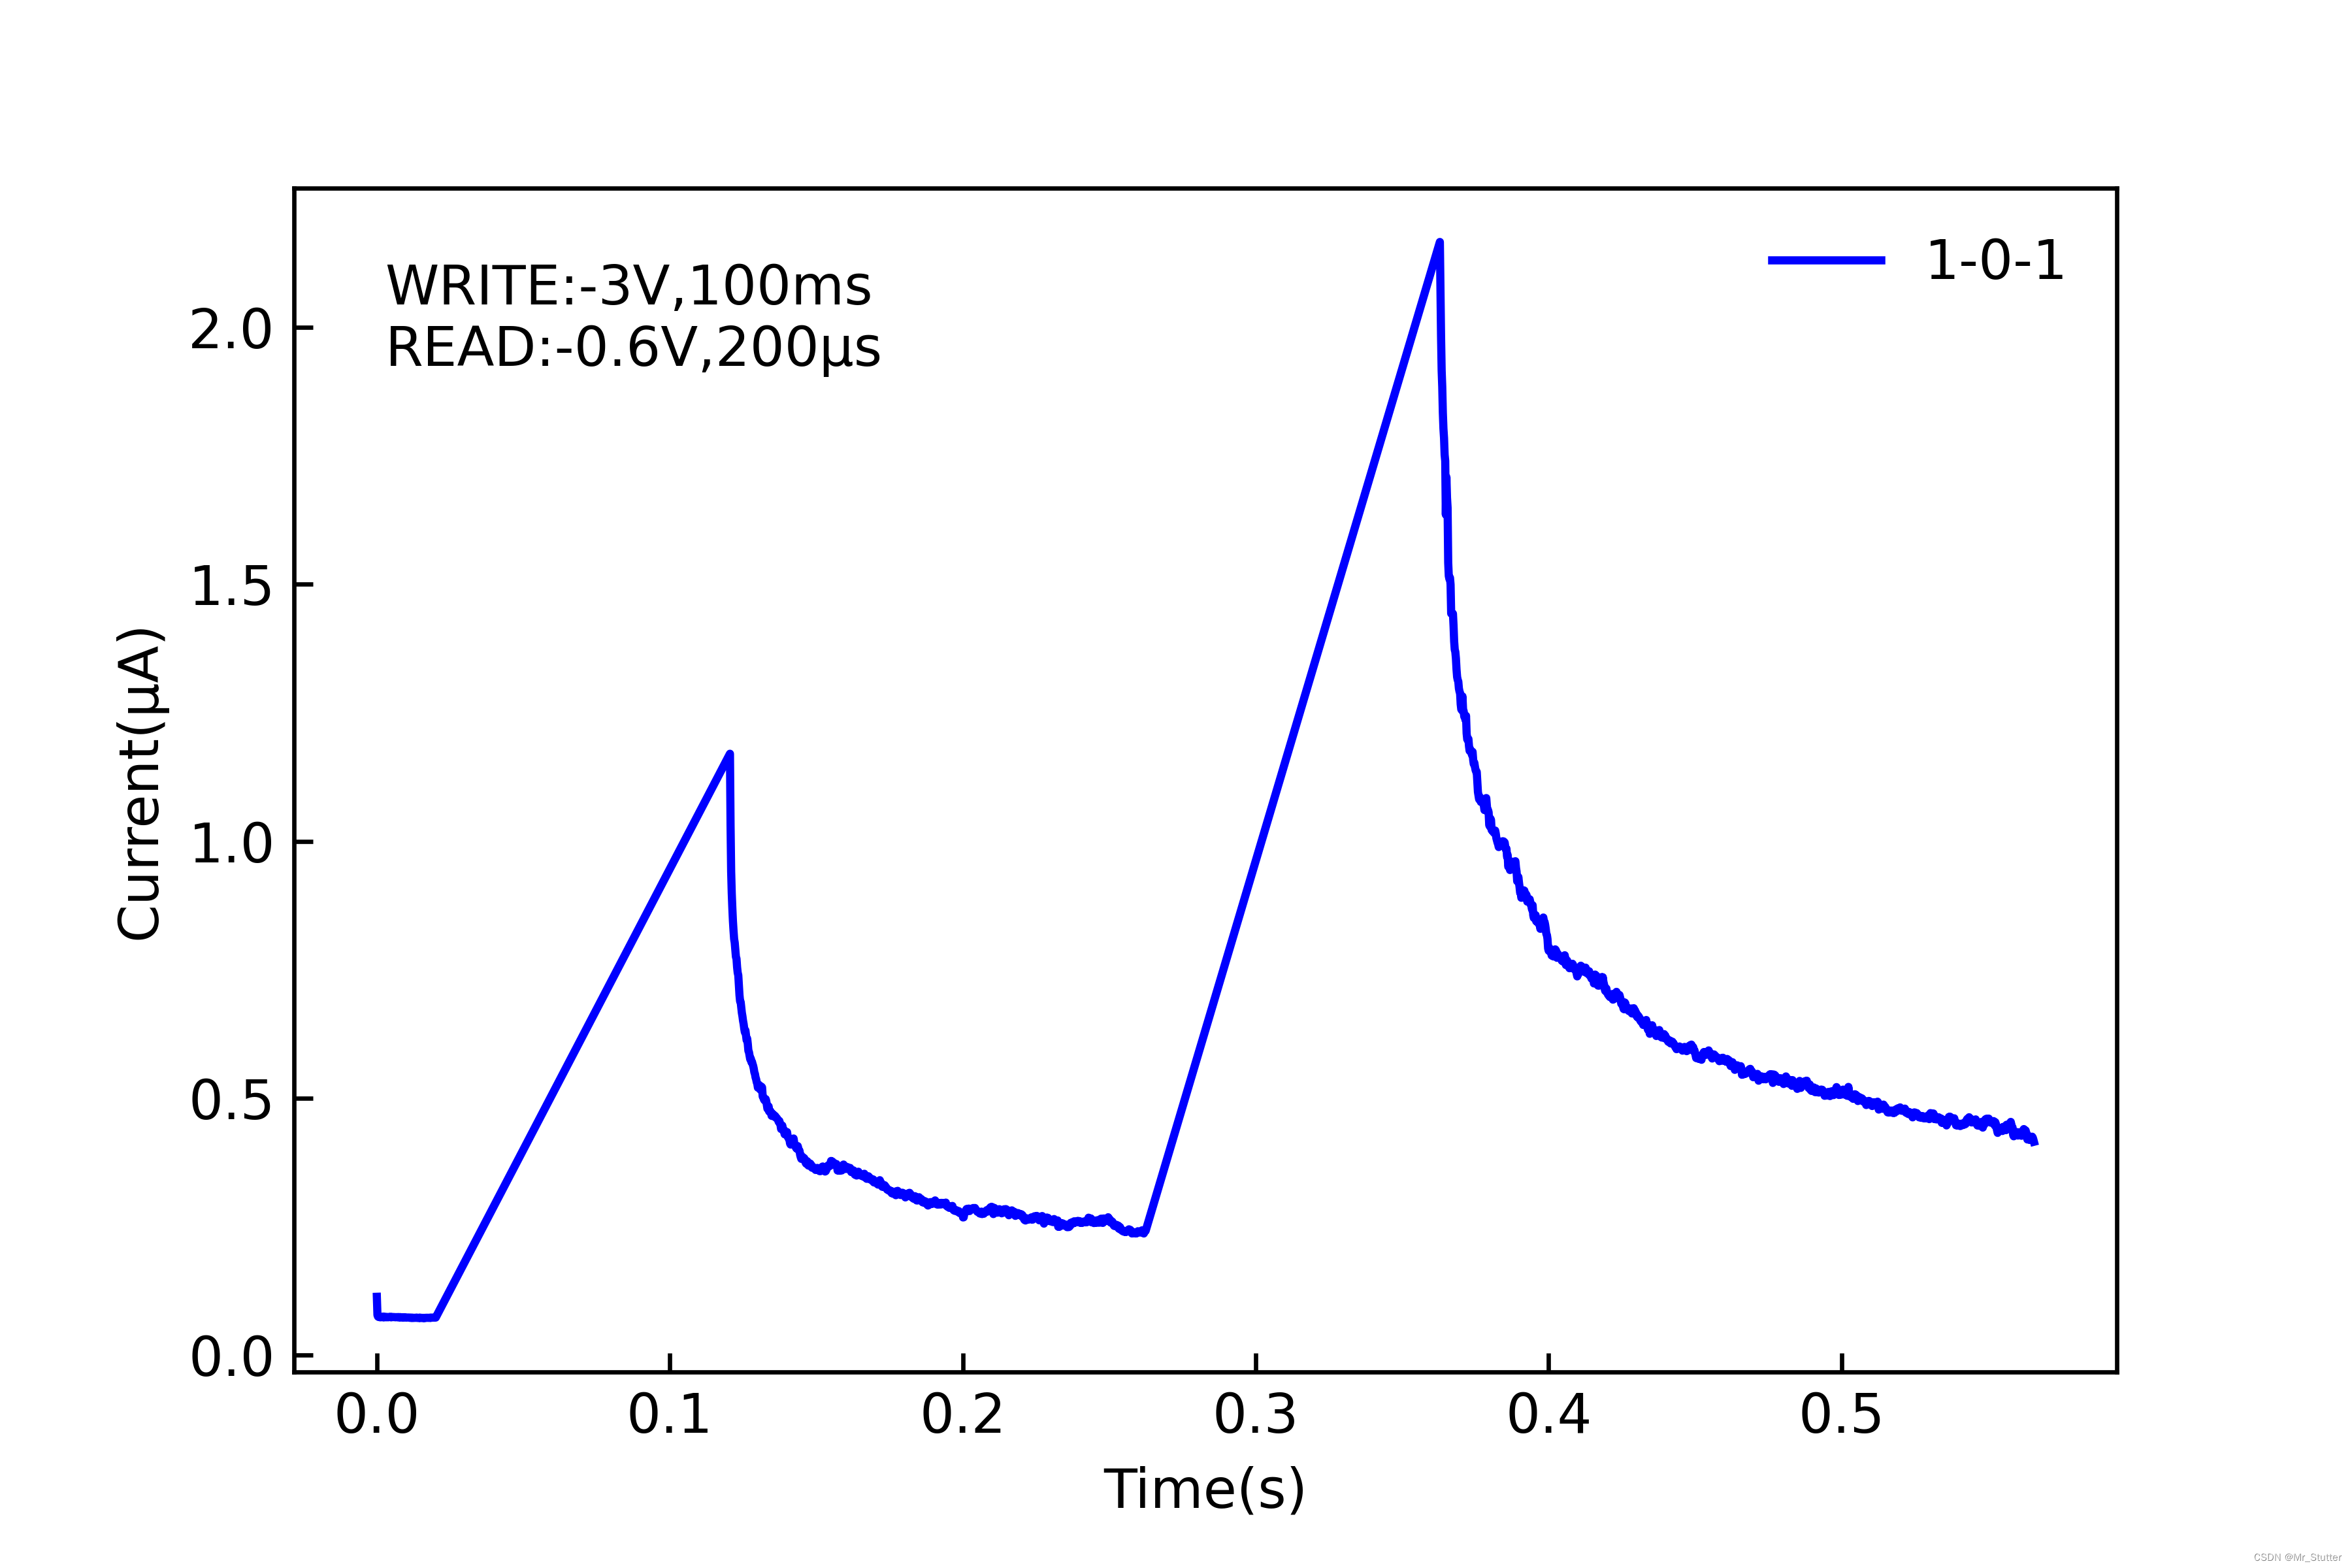
总结
使用Pandas库能够很容易地读取、处理Excel文件中的数据。根据实际需要修改代码比考虑所有情况使用同一代码更加方便灵活。